 Houston, TX– Happy New Year! We hope that 2019 was a successful year for you and hope that the coming year is your best yet.
For me, 2019 was like “driving in the fast lane”. The year passed at surprisingly accelerated speeds.
Overall it was a fantastic year for us. However, we had some unusual challenges too.
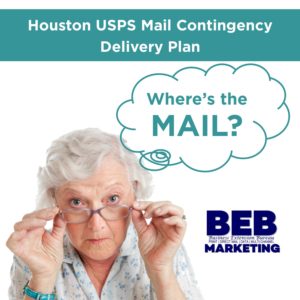
When tropical storm Imelda caused the North Houston Post Office roof to collapse; timely mail delivery within the city took a big hit. As late as mid-November we were seeing local delivery standards crawl between 8-12 days which had a negative impact on many clients.
Information from USPS HQ regarding mail acceptance, contingency plans, and progress to re-open the facility was slow to be shared. It was frustrating because the focus was on national super volume mailers. Invitations to calls with information updates weren’t extended to most of the local Houston mailers, printers or fulfillment houses. Many were left to secure information through the grapevine or other resources. Our involvement with local and national trade organizations really paid off during this timeframe. We were able to sit-in on many of USPS HQ calls and stayed current with progress.
Our partnership with Leo Raymond of Mailers Hub and Tom Glassman of Ricoh; both MTAC (Mailers Technical Advisory Committee) members, were critical and we appreciate their help with getting us included in the loop.
Also, we made a point to share the updates with as many local businesses as possible (even
competitors), through our blog, email blasts, and social media platforms.
 It is these types of situations that remind us of how important it is to seed your mailing list and how tracking can help manage a campaign through a crisis and still be successful. Direct mail is a marketing powerhouse and still produces higher returns than its digital counterparts.
It drives people to websites, social media platforms and converts prospects into buyers.
Fortunately, local marketing mail delivery has since improved significantly. As of the first of 2020, our studies show local delivery times are (on average) between 4-6 days. We anticipate a return to a 3-5 day delivery by the end of January.
In November, we headed to Dallas for (the first ever) Printing United show. What a show it was! Over 30,000 attendees viewed print and mail equipment covering 724,000 sq feet at the Kay Bailey Hutchison Convention Center. We were simply amazed by the technology presented by companies from all over the world. As a result of the show, we made some capital investments that will continue to expand our in-house capabilities and service offerings. We will share details with you in our spring newsletter.
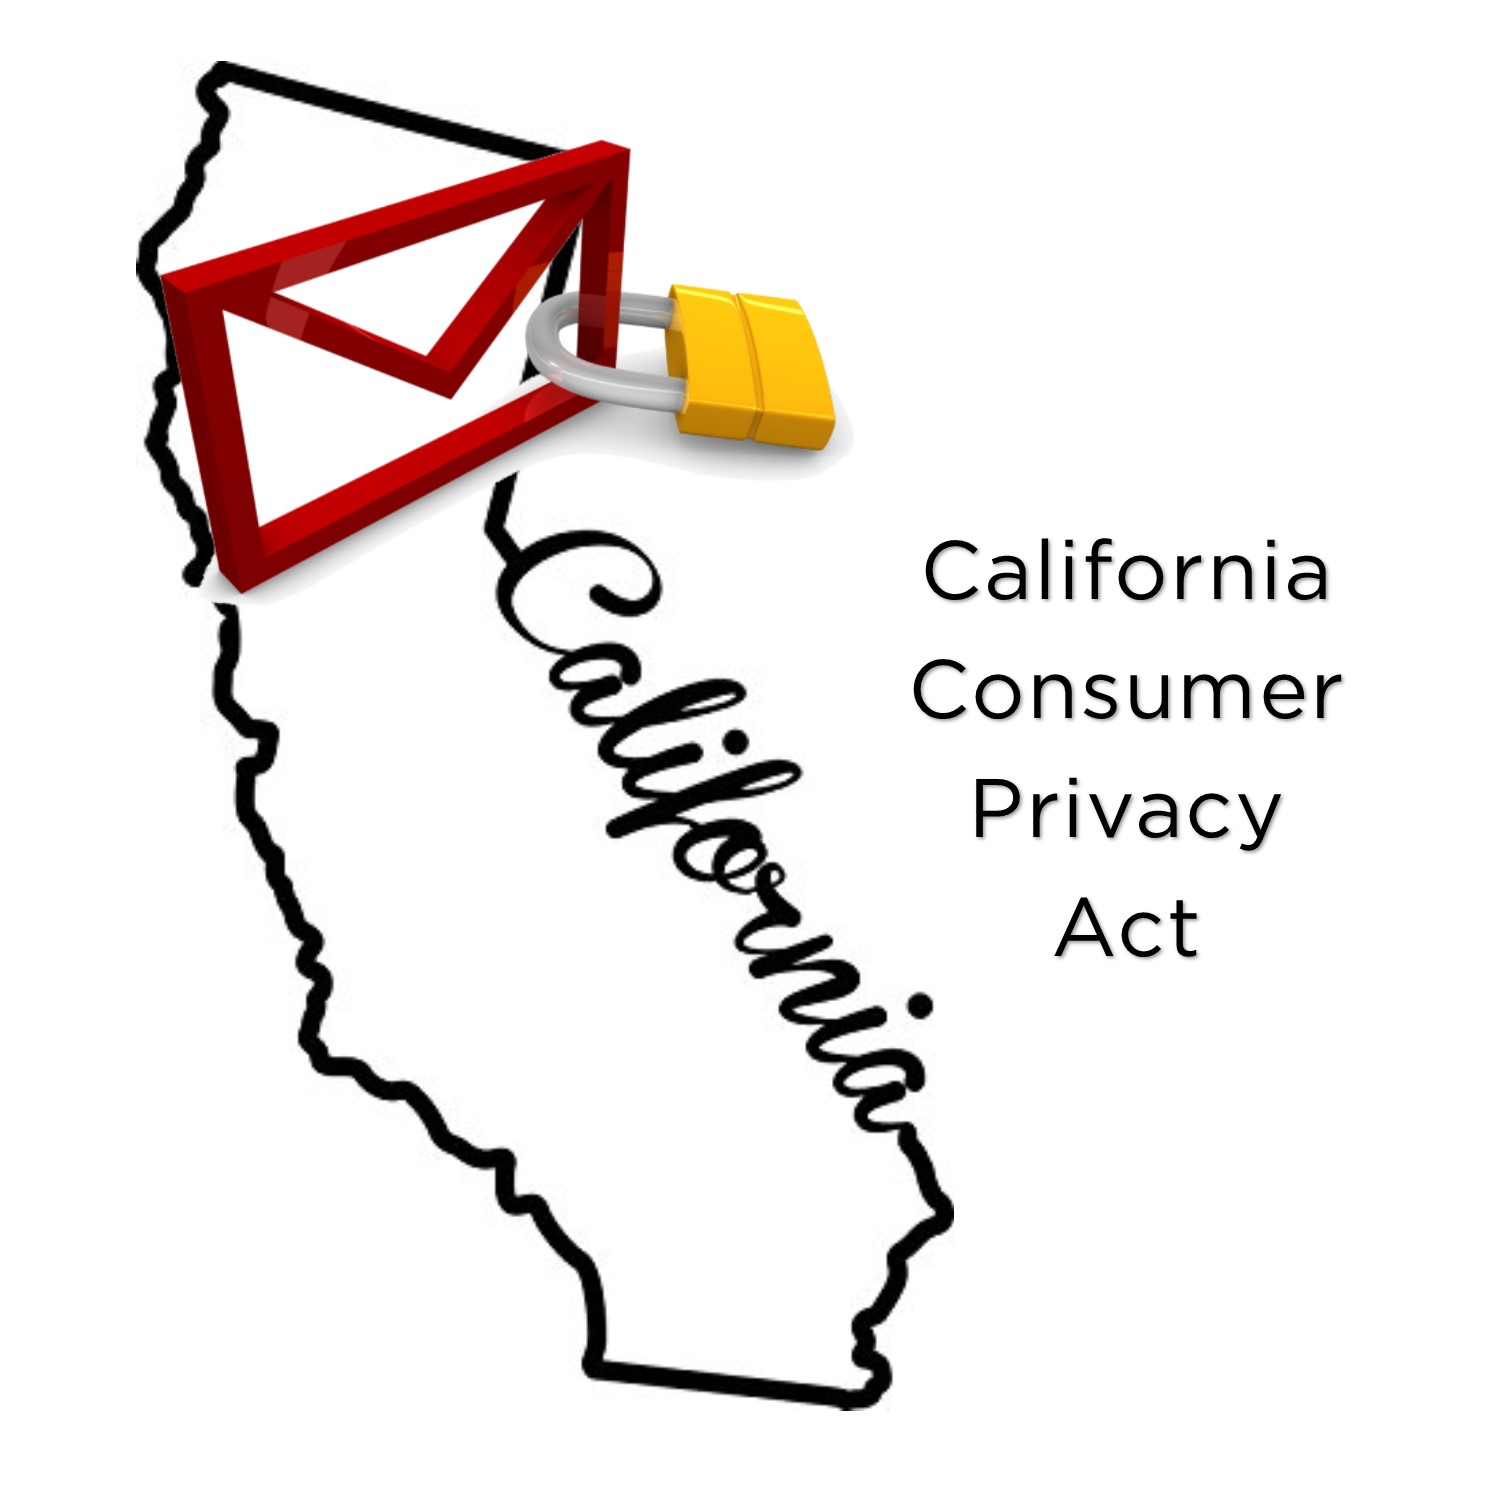
We anticipate this year to be filled with change. For example, starting on January 1st, the CCPA
(California Consumer Privacy Act) went into effect. This represents the start of the US attempt to protect an individual’s privacy as it pertains to data collection. It’s similar to the General Data Protection Regulation (GDPR) which was enacted in May of 2018 by the European Union.
Some of the things the CCPA allows (for California residents) include the right to know what personal information is being collected about them, if their information is being sold and to whom. They have the right to say no to the sale of their personal information and are allowed access to it.
As it is written today, our Consumer Bankruptcy data file is not subject to the CCPA. All Consumer Bankruptcy data is public information which is gathered by the federal courts and is exempt. Go to our online privacy policy page for details.
Privacy is important. However, government regulated consumer data collection could cast a negative impact on the marketing industry as a whole. Data collection goes far beyond social media sites and has been the backbone of our industry since its infancy. Over 20 other states have introduced bills attempting to regulate how data is collected and each bill has their own
idiosyncrasies which will make data compilation and compliance an enormous challenge in the
future.
We hope you enjoy this edition of the bureau. And, as always, we sincerely thank you for your business and partnership. Happy New Year.
Sincerely,

Ron Royall, CEO

 Last November, Instagram began a test to hide “likes” for U.S. users, and announced that it will be rolling out the change everywhere in the world.