Author Archives: bebtexas
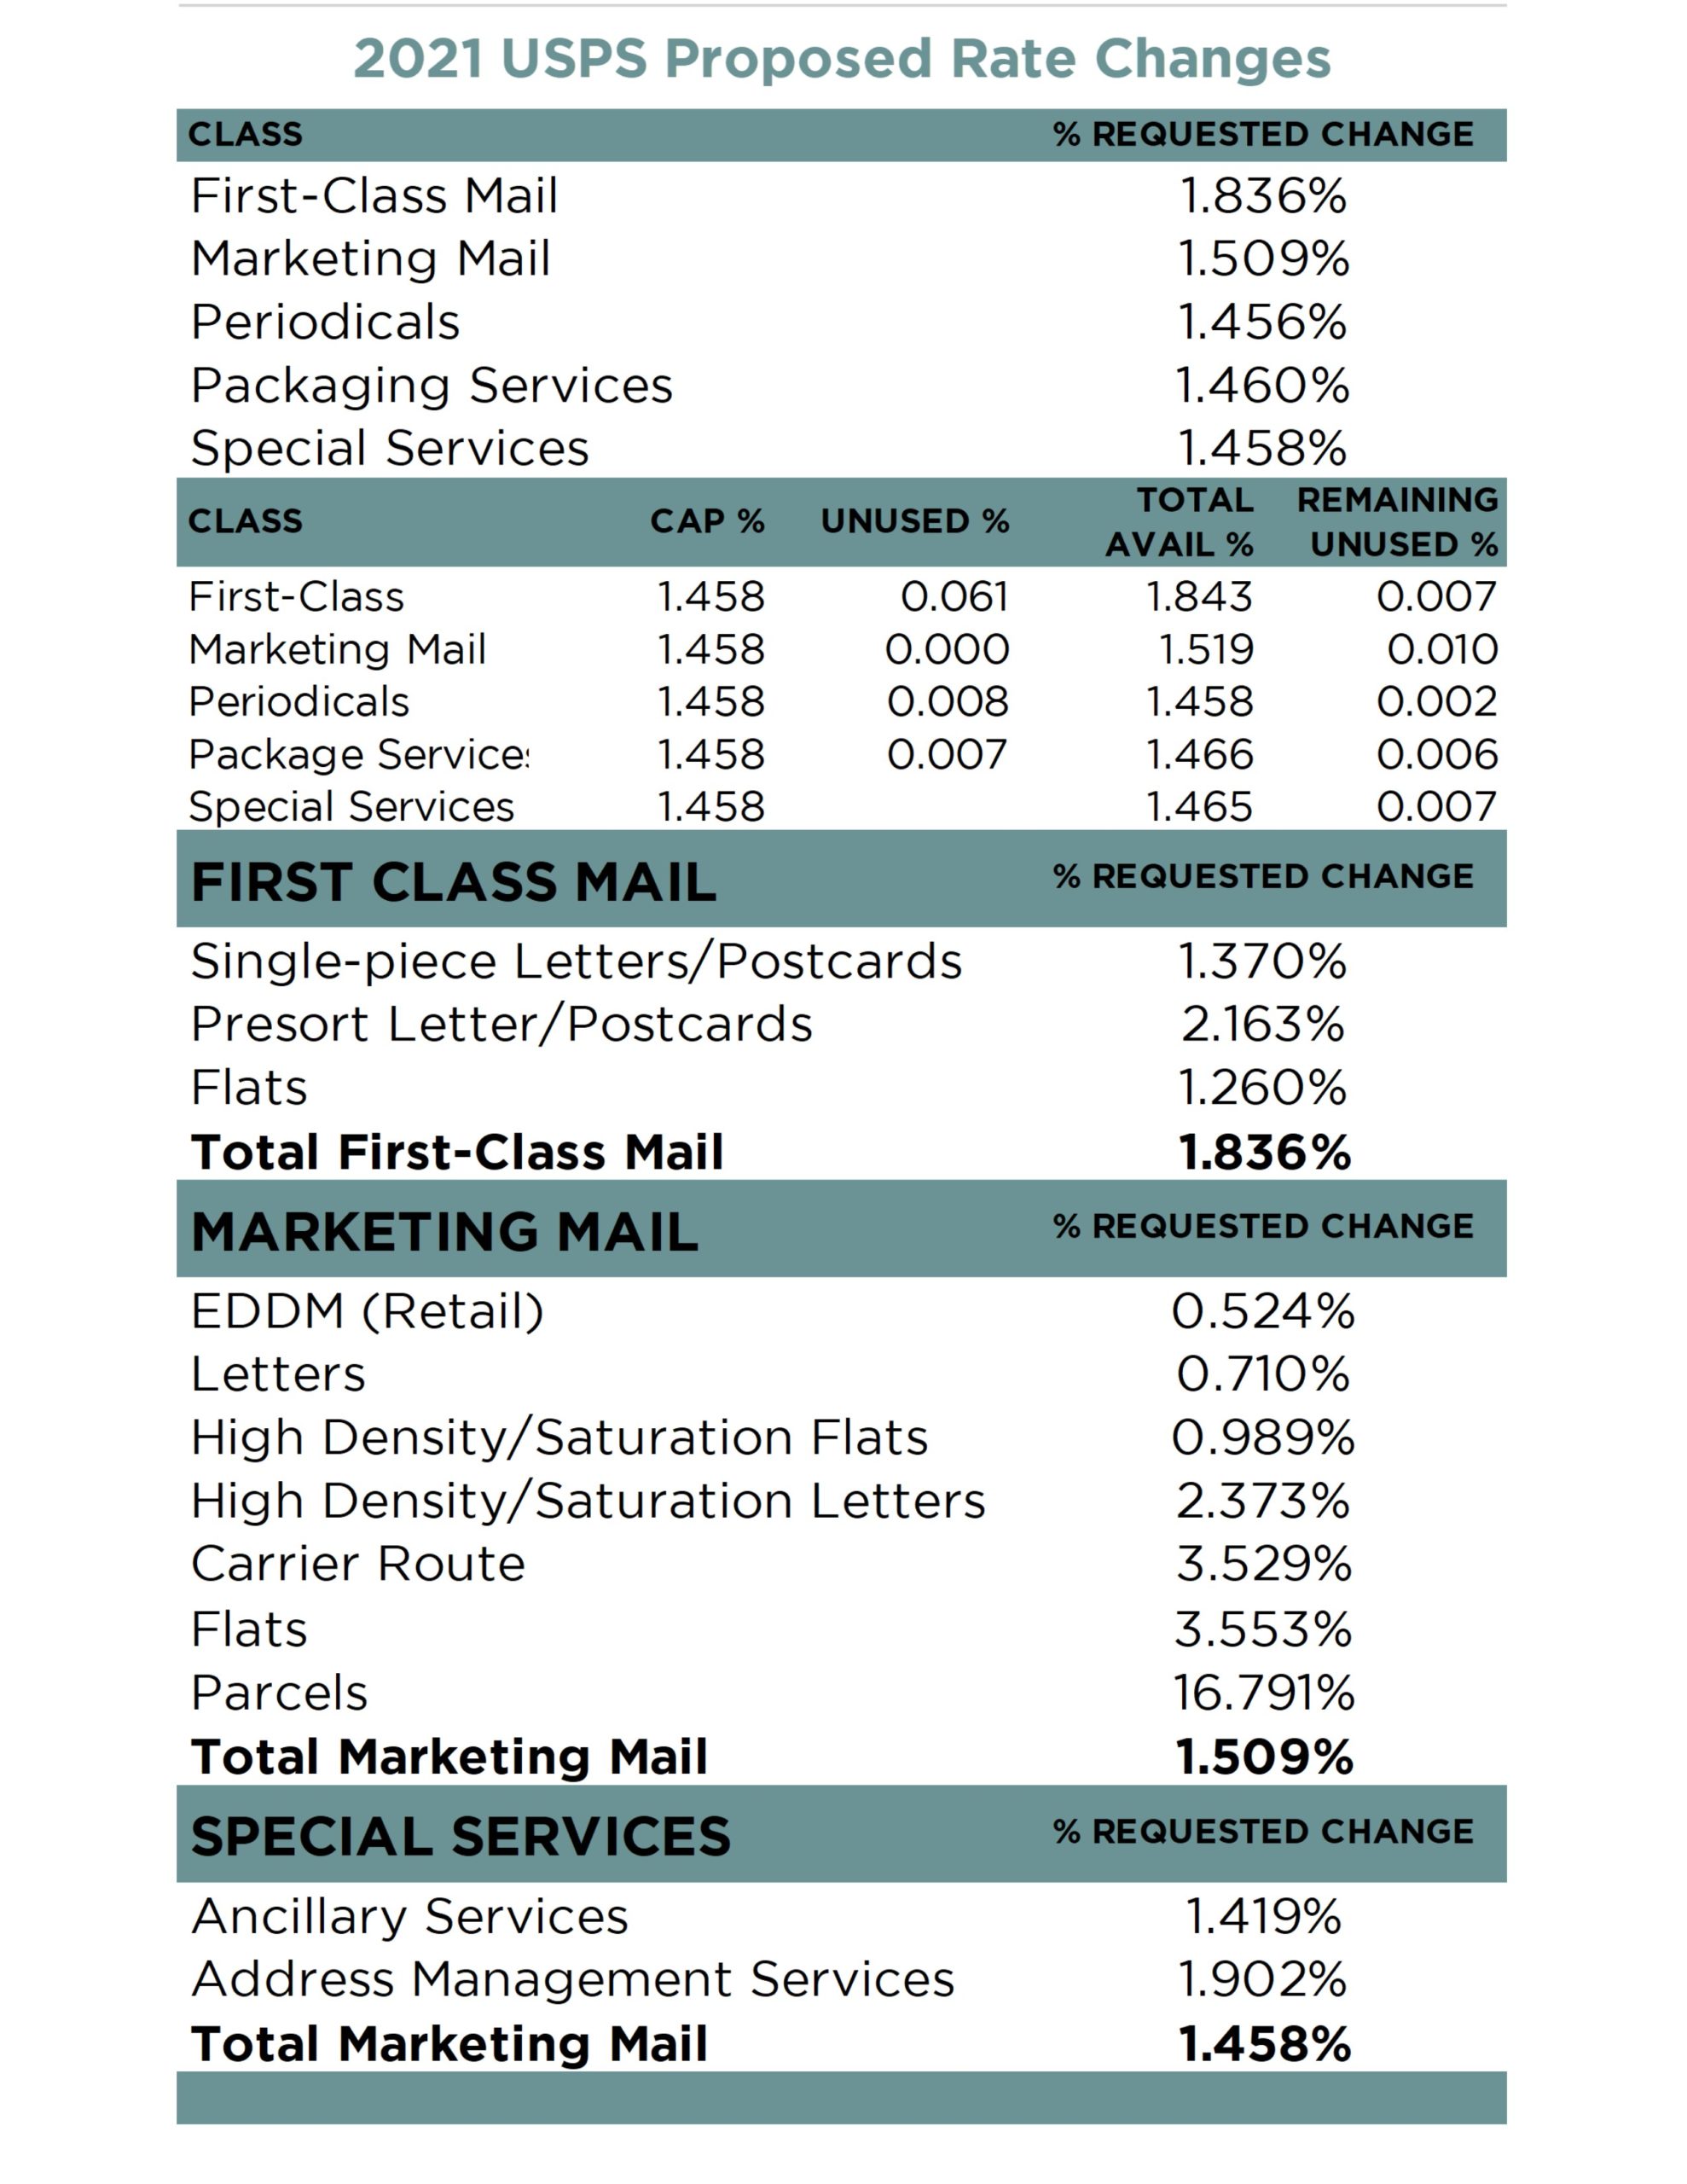
2021 USPS Proposed Rate Changes
On October 9th the USPS filed a request with the PRC (Postal Regulatory Commission) to revise pricing for market-dominant products.
The amount of the proposed increase by class reflects the USPS authority, under the CPI-based cap, plus any unused rate authority left over from previous price changes, that can be carried over. The USPS did not use all of its available rate authority, meaning that some of it will remain “banked” after this case and can be used in the future.
Below is an overview the upcoming rate case:
Click here to see a 2021/2020 Rate Comparison Chart.
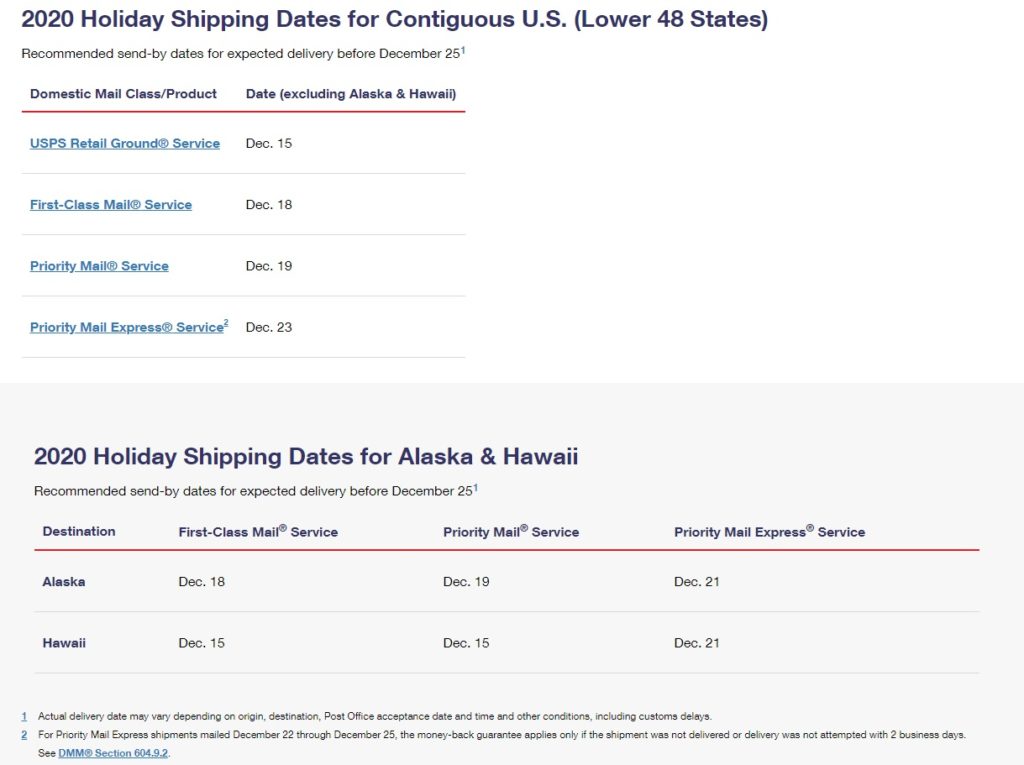
Holiday 2020 Mail Dates-Domestic
Veterans Day
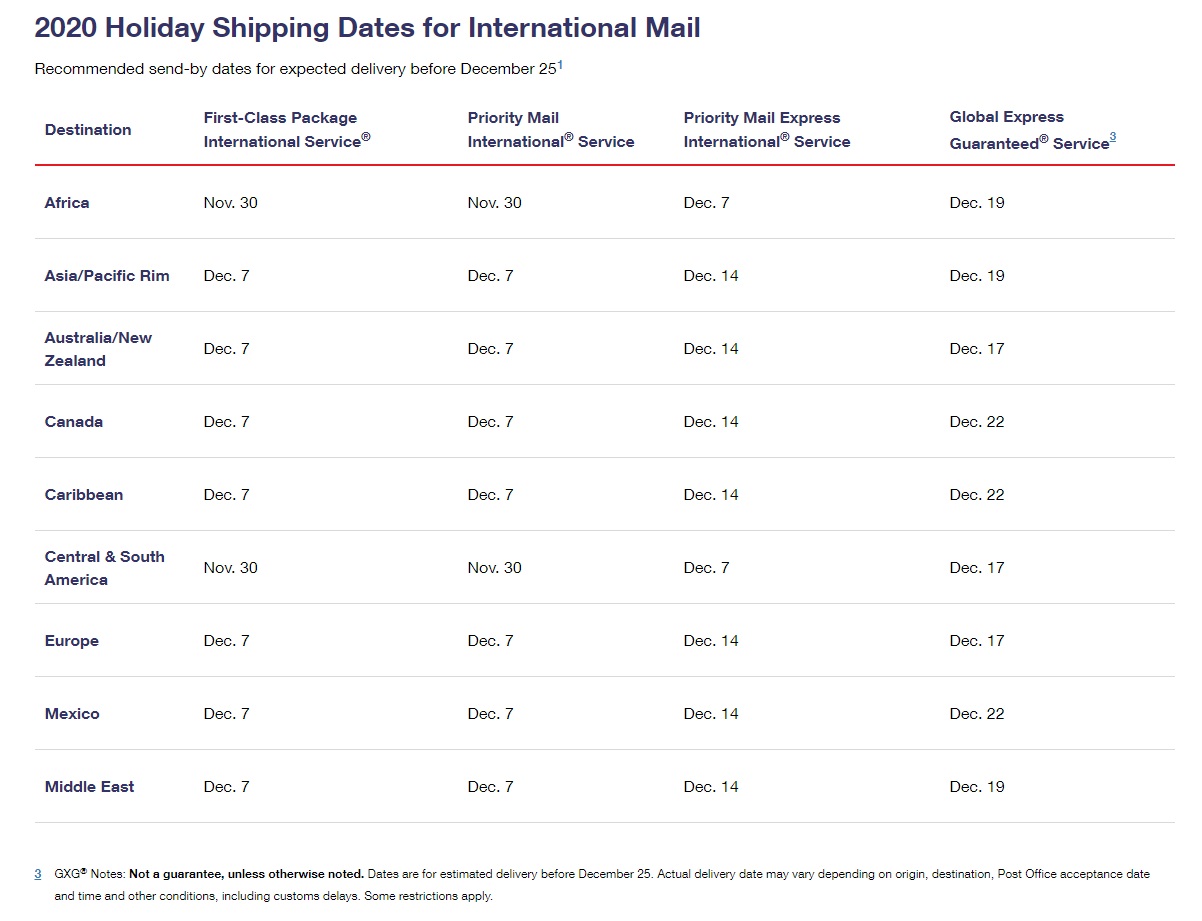
Holiday 2020 Mail Dates-International
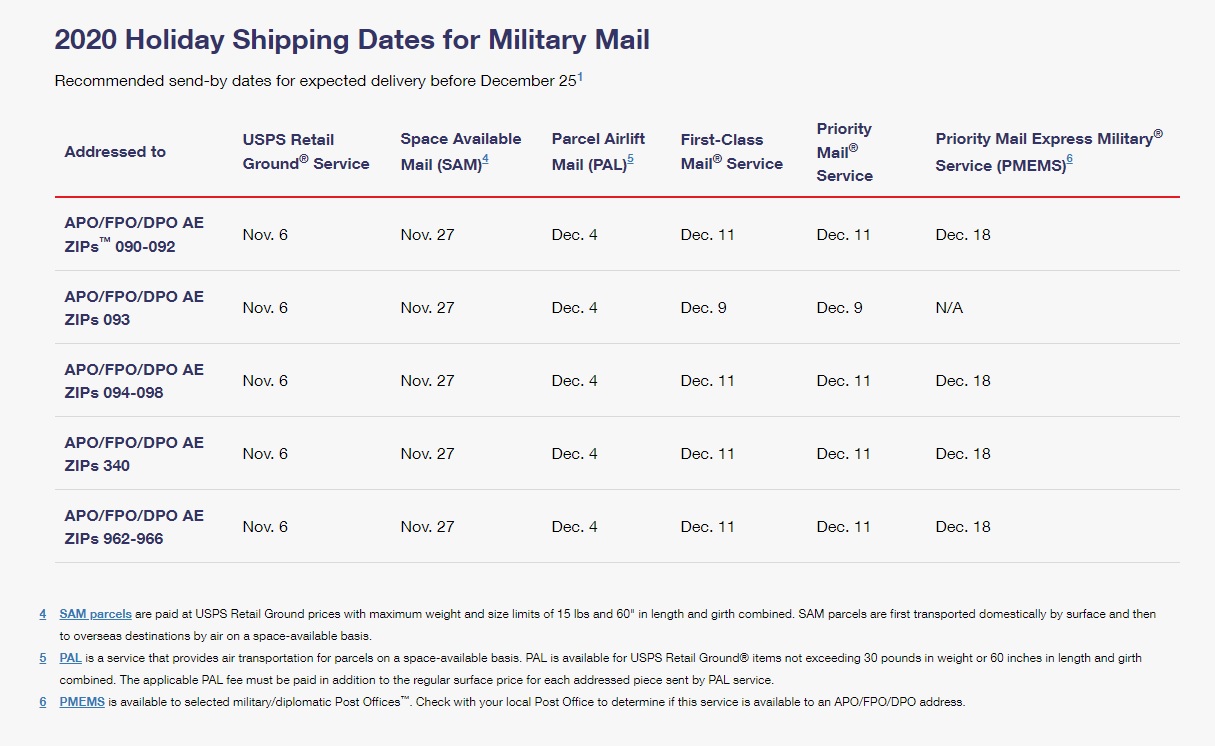
Holiday 2020 Mail Dates-Military Mail
Happy Halloween
Google Core Updates
 Google’s algorithms are a complex system used to retrieve data from its search index and instantly deliver the best possible results for a query. The search engine uses a combination of algorithms and numerous ranking signals to deliver webpages ranked by relevance.
There was a time when Google only made a handful of updates to its algorithms. Today, Google makes thousands of changes every year.
Core updates are designed to produce noticeable effects across search results in all countries and in all languages. Inevitably sites will have gains or declines in rankings after a core update rolls out.
SEO rankings can and do move around…a lot. Changes in search rankings are usually a reflection of the relevancy of your content. This means that if the content on your site has gained relevancy since the last update, it will be upped in search rankings. Unfortunately, the opposite applies as well.
For the second time in 2020, Google released a core update in May which was the first since the pandemic and will likely execute significant changes in search rankings. The first core update of 2020 launched during the second week of January.
Consider how much the world has changed between January and May. In January, coronavirus and COVID-19 were barely on anyone’s radar. Now those words are on the forefront of almost everything. Once the pandemic was declared, users search behavior dramatically shifted, worldwide.
Google reported that there has never been as many searches for an individual topic as there has been for COVID-19. The virus has changed what people need from Google.
This drastic change represents a lot of search words gaining relevancy that had little, if any activity in the past. It also means that search words that were once heavily used, such as travel or concert related searches, aren’t getting the traffic they enjoyed in the past.
The May 2020 Core Update must deal with the unique challenge of identifying the tremendous changes of how and what the world is searching online.
Over time, we will be able to identify the long-term effects of the update. In the interim, Google reminds us that there is nothing to “fix” if your rankings drop after a core update. Remember to routinely make your content the best it can be, keep your website refreshed, and study your activity.
SHOPS by Instagram
 As businesses continue to face the challenges of selling online as they shift their business models during the COVID-19 crisis, Instagram has created Shops. Shops is a new shopping experience through an immersive, full screen storefront that enables businesses to drive product discovery in a native shopping experience.
People can visit a shop from a business’ Instagram profile or through Feed and Stories. Once they’re at the shop, people can browse products, explore collections, and purchase products — seamlessly through an in-app browser and without leaving the app from shops with checkout.
Checkout allows customers to buy items directly from a shop on Facebook or Instagram.
With shops, people have a place to experience the joy of shopping versus the chore of buying. Collections in shops let businesses customize the shopping experience, and curate products into themes that tell their story.
Creating a shop is free and simple. For more information about shops visit Facebook for Business. To learn more about enabling shopping on your Instagram business account, visit the setup guide.
FB Says NO to Certain Political Ads
 Facebook announced that it is taking preventive steps to “protect the integrity of the upcoming US 2020 elections.”
Ads related to the US 2020 census participation and voting around the November 3, 2020 election are now subject to additional prohibitions. Ads targeting the US with the following content are not allowed:
- Ads that portray voting or census participation as useless/meaningless and/or advise users not to vote or participate in a census.
- Ads that delegitimize any lawful method or process of voting or voting tabulation (including in-person voting on paper or on machines, absentee voting, vote by mail, and lawful collection of ballots) as illegal, inherently fraudulent or corrupt, or will result in a fraudulent or corrupt election administration or outcome.
- Ads that delegitimize an election and/or result as fraudulent or corrupt because the result can’t be determined on the final day of voting and/or before ballots received after the final day of voting are lawfully counted.
- Ads that claim voter fraud (such as voter impersonation, duplicate voting, or non-eligible individuals voting) is widespread and/or alters the outcome of elections and/or results in a fraudulent or corrupt election.
- Ads that claim the election date or the mechanism for electing the President can be changed in ways not permitted by the Constitution or federal law.
- Ads with premature claims of election victory.
- Ads that are inconsistent with health authorities on voting safely.
To better facilitate public scrutiny for ads about social issues, elections or politics in the final week of the campaign, we’re introducing a restriction period for ads about social issues, elections or politics in the US. Advertisers will not be able to create and run new ads about social issues, elections or politics in the United States between October 27, 2020 through November 3, 2020. Changes to budget, bids, and targeting will be allowed during this period. However, any edits related to creative, placement and optimization will not be allowed. We recommend you to routinely check their FB Help Center page for updates and the latest information.
Ads about social issues, elections or politics in the United States must be created and start delivering before October 27. If you’re planning to run existing ads about social issues, elections or politics during this restriction period, you’ll be able to:
- Pause existing ads
- Unpause paused ads as long as they delivered an impression before October 27 and are stored in the Ad Library
- Edit the schedule (e.g. new end date)
- Edit the bid amount
- Edit the budget
- Edit the targeting, e.g. geographic or demographic changes, change the interests, upload a new custom audience and create a lookalike
- Note: Editing the targeting will send the ad back through ad review. Advertisers may wait up to 72 hours for political/issue ads to be reviewed.
If you’re planning to run existing ads about social issues, elections or politics during this period, you will not be able to:
- Edit or upload new video assets
- Edit or upload new image assets
- Edit or provide a new landing page
- Edit or provide a new caption (body text)
- Boost an organic post
- Change the objective for the ad
- Change the Page that the ad is running from
- Run the ad from a new ad account
- Change the conversion tracking (pixel, pixel event)
- Change the optimization
- Change the bid type
- Remove the “Paid for by” disclaimer
- Edit the placement
- Duplicate these ads
If you’re planning to run ads about social issues, elections or politics for the first time:
- You’ll need to get authorized to run ads.
- Your ads must have an impression by October 27. FB recommends advertisers to prepare accordingly as ID verification reviews typically take 48 hours, disclaimer reviews take 24 hours and ad reviews take 72 hours.
- Run messages that will stay relevant through Election Day. For instance, it’s best to reference voting on “Election Day” or “November 3” versus “tomorrow” or “today”.
- They also recommend that you get started with the ad authorization and ad setup process as soon as possible. While we’ll adhere to standard turnaround times as closely as possible, we urge you to get authorized and set up ads early to avoid potential delays.
For more information and best practices, refer to the FB best practices one-sheeter.


