
Global spending on Artificial Intelligence (AI) is expected to reach $35.8 billion this year. That’s up 44% from last year. It’s expected to double to over $79.2 billion by 2022.
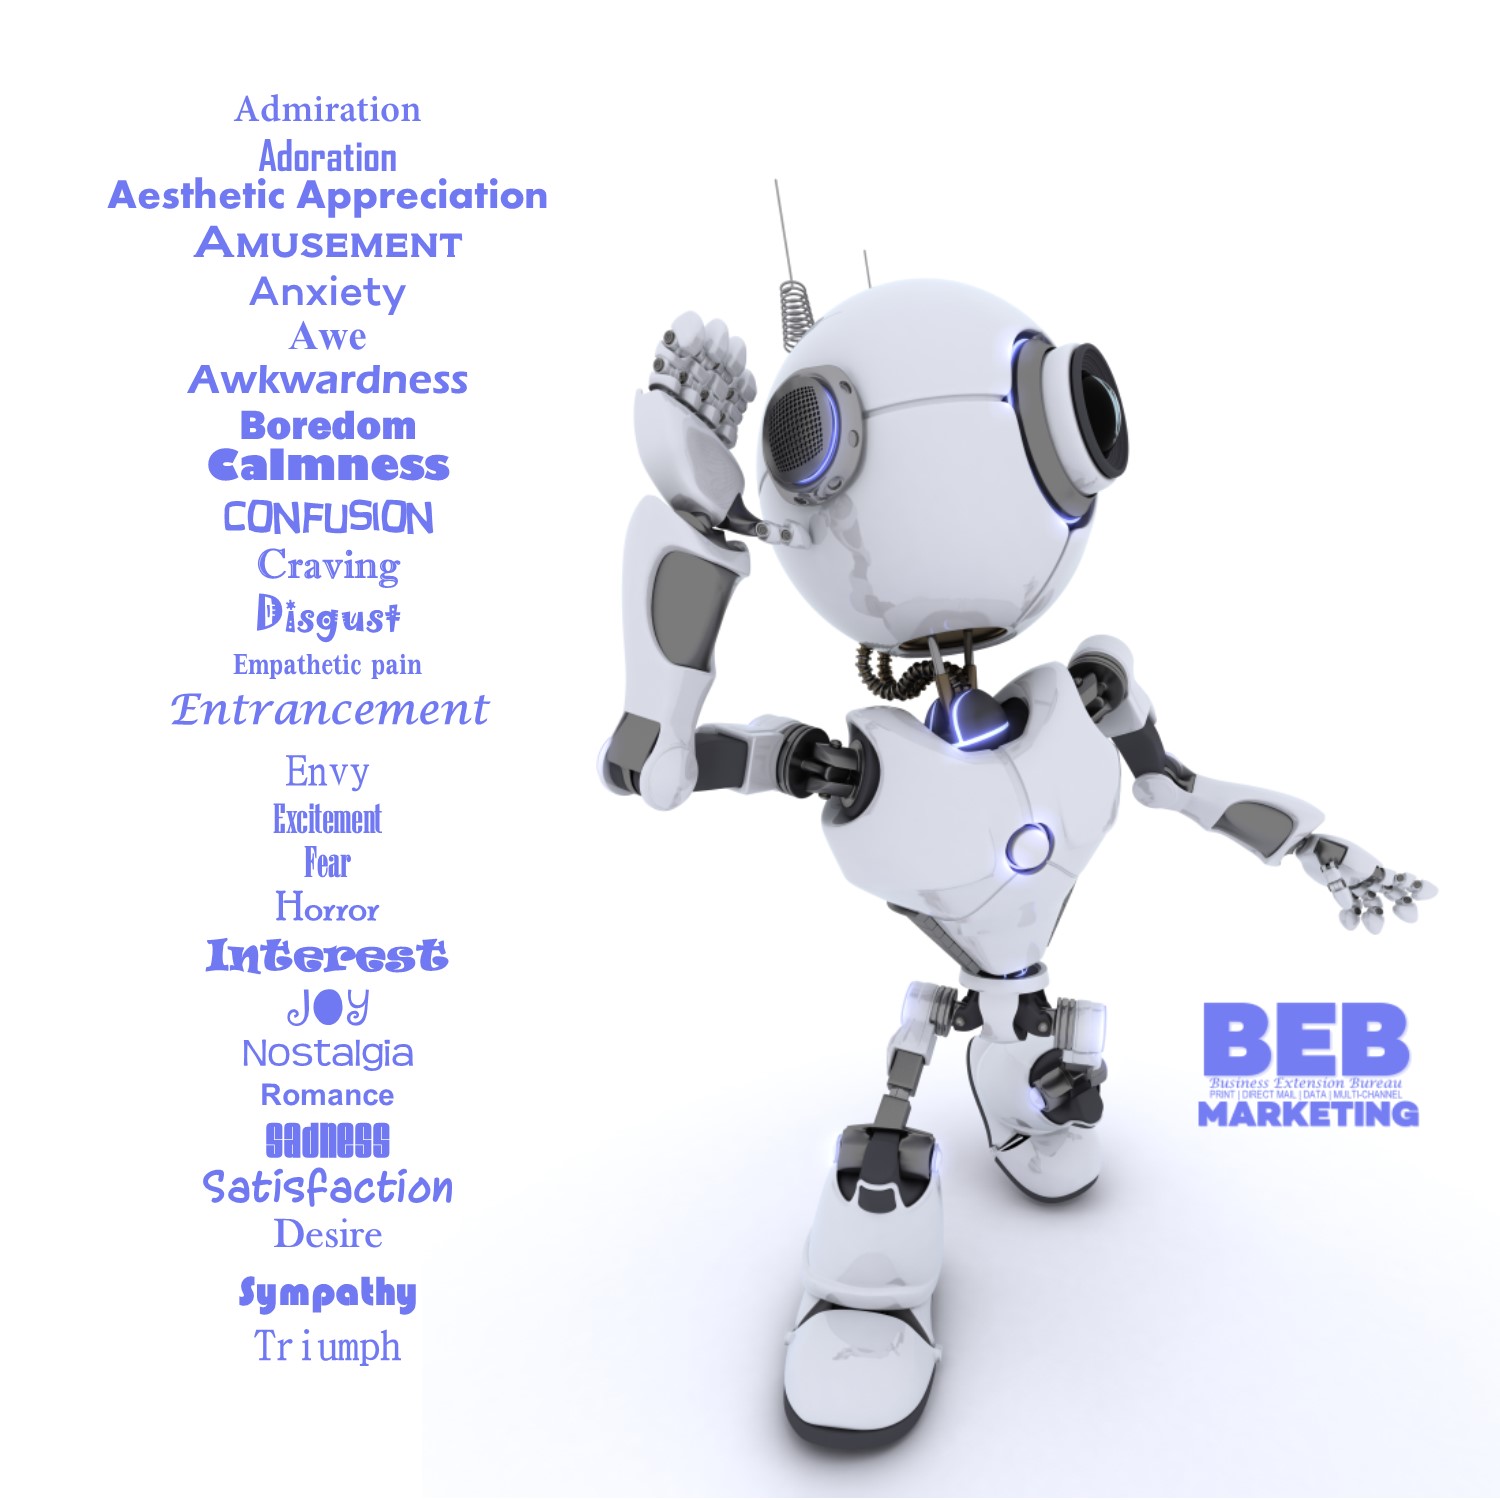
Below are some terms that will help you to better understand this exploding and learned technology.
Natural Language Processing (NLP) –A subfield of computer science, information engineering, and AI focused on interactions between computers and human language. When text or speech is input and it can be read or extract meaning.
Artificial Intelligence (AI)- Sometimes called machine intelligence, AI is intelligence demonstrated by machines. These machines mimic “cognitive” functions that humans associate with other human minds, such as “learning” and “problem solving”.
Deep Learning -Sometimes referred to as deep structured learning or hierarchical learning, it is part of a broader family of machine learning methods based on artificial neural networks.
This powerful statistical technique is used for classifying patterns using large data sets and ANNs (Artificial Neural Networks). Deep learning neural networks have been applied to fields including natural language processing, social network filtering, drug design, medical image analysis, and game programs. They have produced results comparable to and in some cases superior to human experts.
Machine learning (ML) -The scientific study of algorithms and statistical models that computer systems use to effectively perform a specific task without using explicit instructions, relying on patterns and inference instead. Machine learning algorithms build a mathematical model based on sample data, known as “training data”, in order to make predictions or decisions without being explicitly programmed to perform the task. Machine learning is closely related to computational statistics, which focuses on making predictions using computers. The study of mathematical optimization delivers methods, theory and application domains to the field of machine learning. Data mining is a field of study within machine learning, and focuses on exploratory data analysis through unsupervised learning. In its application across business problems, machine learning is also referred to as predictive analytics.