Tag Archives: Facebook

Houston Zoo’s Virtual Visits

Our Zoo is the BEST! Talk about thinking outside of the box. At 11am on their Facebook Page everyday we get to visit the Houston Zoo!

The Houston Zoo started using Facebook Live to bring their patrons , many who were stuck at home due to the COVID-19 stay-home order, a glimpse of the daily lives of their animals.  Live videos featured some of the animals guided by zookeepers so fans could see what they are up to. The Houston Zoo welcomed Facebook followers online questions and answered in real-time.

During times of crisis, it pays to put yourself in your clientele’s shoes and think outside of the box!

Facebook IQ, What Is It?

Facebook IQ is a culmination of a year’s worth of research and insights. The team explored thousands of topics from January 2018 to June 2019 on Facebook. Where patterns emerged, they looked to third-party research and media sources to inform and validate their findings.
New in 2020, they reported trends beyond the US to 13 new countries in four regions:
Argentina, Australia, Brazil, Canada, France, Germany, India, Indonesia, Mexico, the
Philippines, Sweden, Thailand and the UK.
For each topic of conversation, they relied on aggregated, anonymized, country-specific data from January 2018 to June 2019 for people ages 18 and older who use Facebook. All topics chosen to be featured grew from June 2018 through June 2019. The topics are presented in the original language as they appeared in their data set.
The analysis covers trends across six categories: Art and Design, Beauty and
Fashion, Entertainment, Food and Drink, Mind and Body and Travel /Leisure.

Facebook IQ 2020 Annual Topics Report delivers insights to understand consumer
behavior, drive more effective marketing and transform the way your business
reaches people. Learning from the billions of people on their platforms and
the millions of businesses that advertise with Facebook, the report provides insights into
behaviors across generations, markets, devices and time.  Click here to read the report.


A World Without Facebook

I read such an interesting article by The Economist the other day.  It was called; “What would happen if Facebook was turned off? Imagine a world without the social network”

30% of the world’s population (2.3billion people) engage with Facebook every month. Economists estimate that it yields trillions of dollars’ worth of value for its users. Facebook is also blamed for all sorts of social horrors: from addiction and bullying to the erosion of fact-based political discourse. This article outlined some new research that suggests that it may be time to consider what life without Facebook would be like.

Hunt Allcott, of New York University, and Luca Braghieri, Sarah Eichmeyer and Matthew Gentzkow, of Stanford University, published results of an experiment where they recruited several thousand Facebook users and sorted them into control and treatment groups. Members of the treatment group were asked to deactivate their Facebook profiles for four weeks in late 2018. The researchers studied what happened.

On average, those that disengaged enjoyed an additional hour of free time. They tended not to use those additional 60 minutes to flock to other websites or social networks.  Instead they spent time with friends and family or watched television. They also consumed less news, and as a result became less aware of events.  In turn they also became less polarised in their views about events than those still on the network. Leaving the social network boosted self-reported happiness and reduced feelings of depression and anxiety.

Read the article in its entirety here.

Summer Classes SOLD OUT

Today our Marketing for Small Business Summer Seminar Series completely SOLD OUT!  This is our 4th series in a row to fill to capacity, and we are so excited.  Can’t wait to meet the many exciting businesses and entrepreneurs attending.  The classes are always interactive and a hotbed for learning.

Our next scheduled series is Marketing for Small Business, The Basics to be scheduled in January 2018.  

Which Social Media Platform is Best for Your Business

which-platform-is-the-bestWhich platform is best for your business?  The best way to determine that is to find out who is on those platforms.

Referencing data from the Pew Research Center’s Annual Internet Project Survey, 72% of adults online are on Facebook.  28% are on Instagram, 25% on LinkedIN, and 23% are on Twitter.

gender-demographicsThere are more women than men on Facebook and Instagram.  Though almost even, LinkedIN older-couple-african-american-computer-smilingand Twitter have more men users than women.

Young adults are still the most likely to use social media.  90% of online adults ages 18-29 are active while 77% aged 30-49 are also active on social media.  However, the fastest growing segment are adults aged 50-64.  51% are engaged on a social platform (up 5% from 2005), and  35% of adults aged 65+ partake in the medium.  That’s up from 2% in 2005.

income-and-education-demographicsThe study reviews income and education demographics of multiple social platforms as well.  By reviewing each of the demographics, you will see a general profile of the people using specific social sites.  Here’s a couple of quick reviews:

Facebook

Founded in 2004, this 12-year old platform is the most used social site.  It’s been around the longest too.  An entire generation has “grown up” on it.

facebook-profile70% of Facebook users check their account daily.  On average, users check their account 14 times a day.

TWITTER

This 10-year old platform touts 313 million active monthly users.  Over 50 million tweets are posted daily.  Who is posting all of that information?

twitter-profile36% of Twitter’s users check their account daily.

Adding an interesting mix to the fold are the statistics showing people on multiple platforms.  Over 25% of online adults are engaged in more than one social network while 17% are on three.  This is growing trend worth watching.

You can learn more about “who” is on “which” platform by attending our Marketing for Small Business Social Media Classes.

Your business should be active on at least one social platform.  Advertising is inexpensive, it helps your search engine optimization (at no cost), and enables your clients (both existing and potential) to interact with you.  If you know who your clients are, choose the platform that has your audience/client base engaged and get started today!

FACEBOOK’S FOUR NEW ADVERTISING SOLUTIONS

facebook-fLast month, Facebook announced 4 new advertising solutions launching in 2016 during the Cannes Lions Festival in Cannes, France.  The focus is on accelerating the shift to mobile advertising as the platform boasts 1.6 billion active users on Facebook and another 500 million on Instagram.  The new solutions include:

  1. Audience Insights Application Program Interface (API)

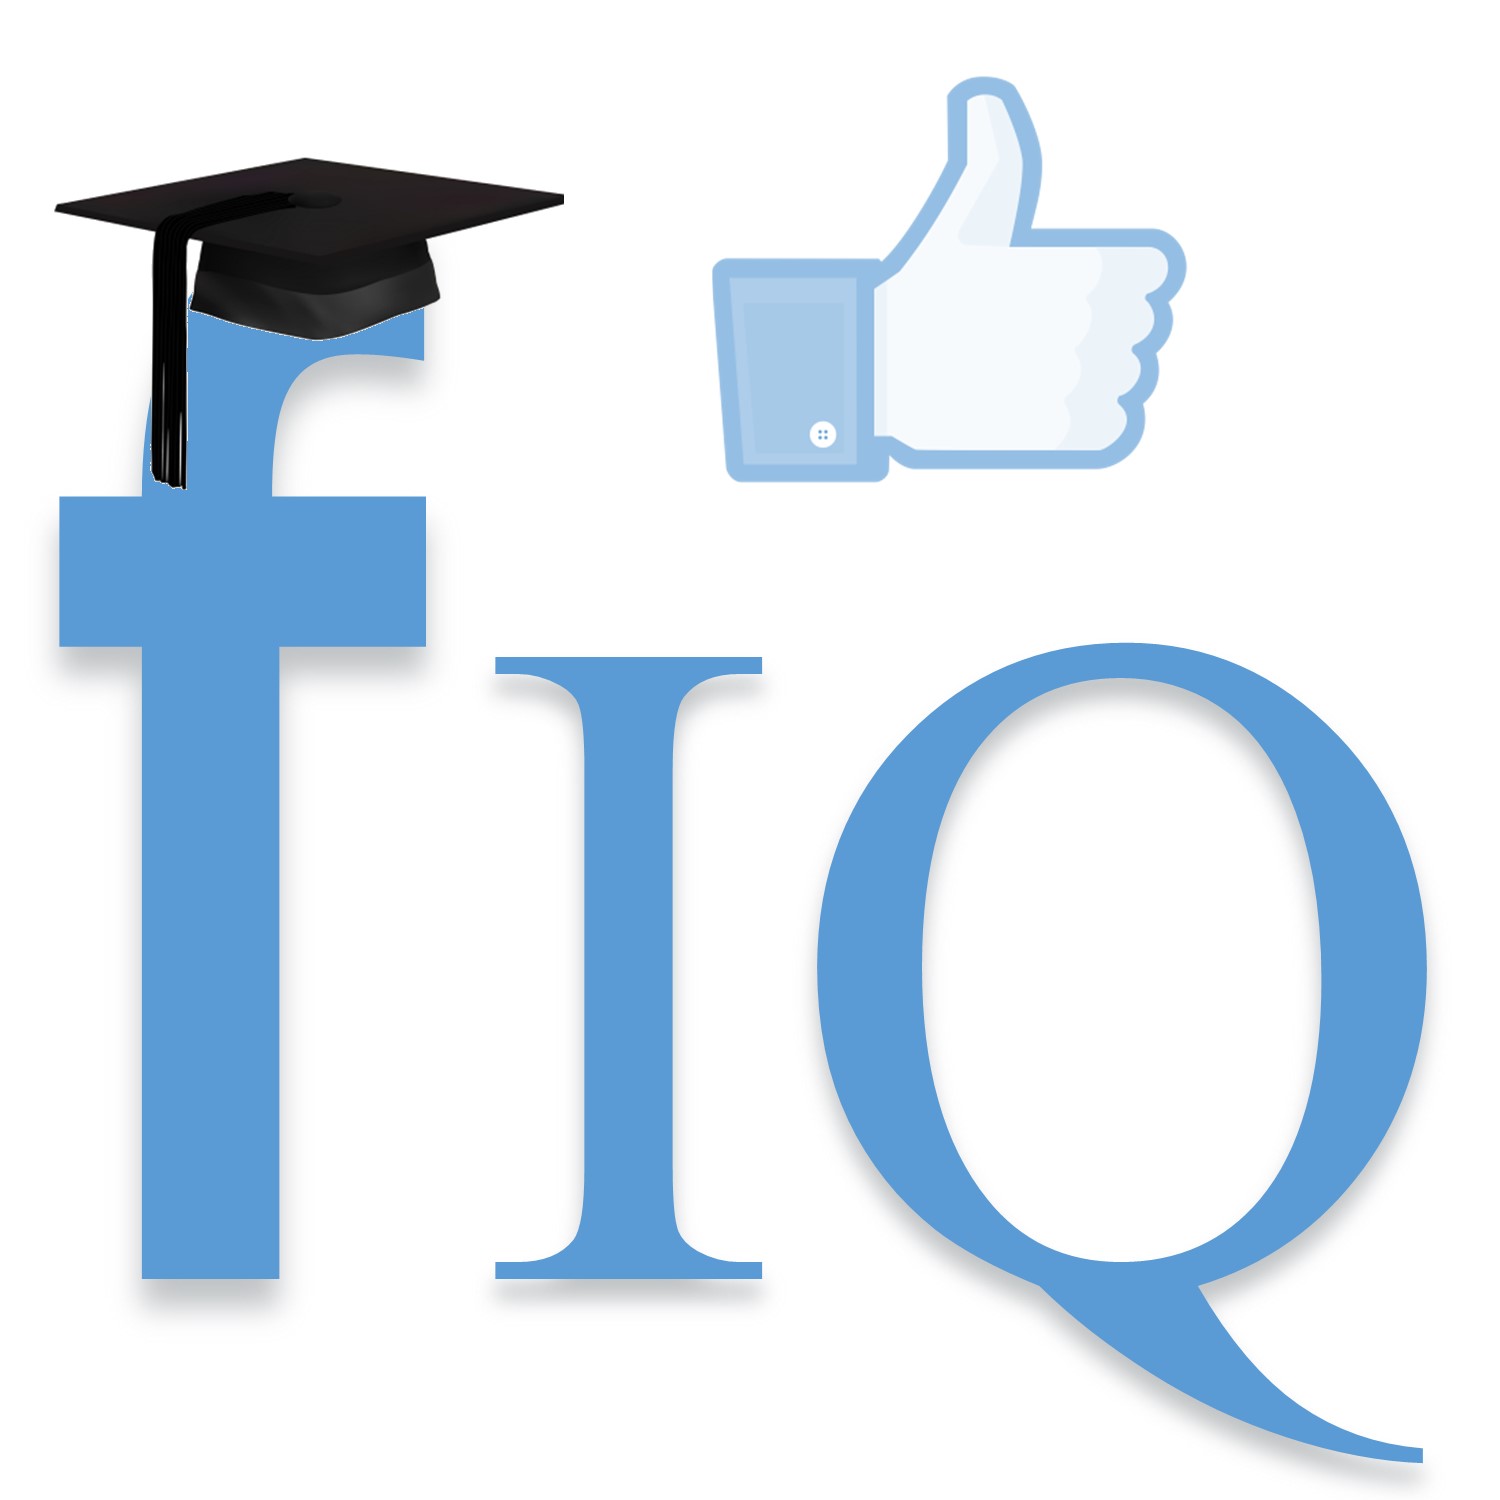
Facebook partnered with a small group of advertisers, like Mondelez International (an American multinational confectionery, food, and beverage conglomerate based in Illinois which employs about 107,000 people around the world) and Anheuser-Busch InBev (the world’s largest brewer with 25% global market share), to develop insights from composite and unidentified demographics, psychographics, topic data and reports from Facebook IQ. The teams have been able to use these insights to create effective campaigns. The Audience Insights API will be available to partners early next year.

  1. Improvements to Canvas

Introduced last year, Canvas is a post-click, full-screen, immersive mobile ad experience thatartist loads instantaneously.  It is designed to help businesses tell stories and show products on mobile devices in a beautiful way.  Updates include steps to make it easier for marketers to design, create, share and gain insights, the ability to share Canvases with stakeholders to simplify the review process and it will have a new feed unit to help entice people to engage. In addition, Canvas will be available for all Pages to use in a post (even when it’s not promoted as an ad).  Also, marketers will be able to access detailed metrics such as dwell time per component and clicks per component to track performance.

  1. Enhancements to Slideshows

Slideshow ads make it easy for businesses to create videos from photos. It gives the ability to create, edit and promote video ads in seconds and are five times lighter than the average video file, which means they’re ideal to reach people on slow connections.  Audio and text overlay, an easy “video-to-slideshow” creation tool, the ability to create from a mobile device and integration with Pages Photo Library and Shutterstock image library are the latest enhancements.  These tools will be available to all advertisers and can be used however you would use a video.

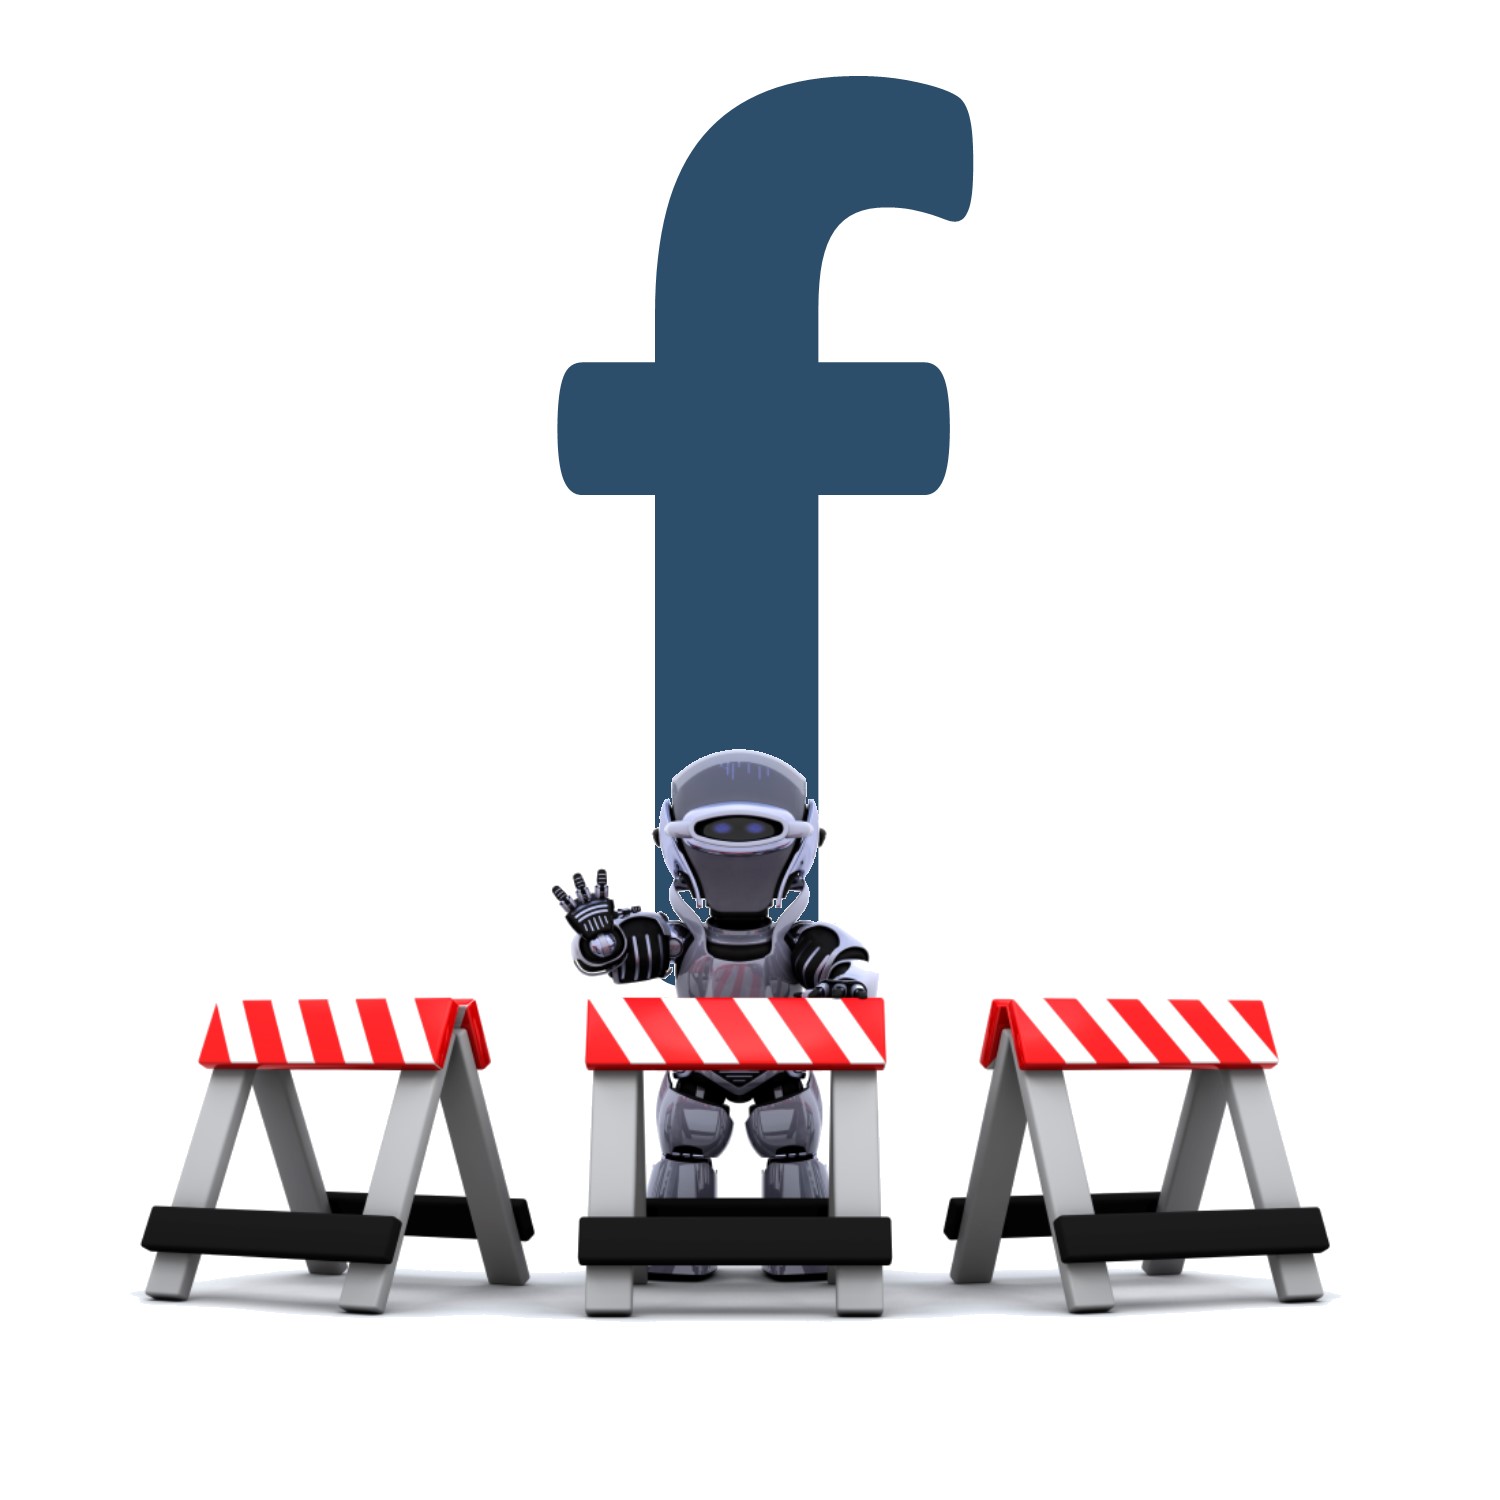
  1. Introduction of Creative Hub

People consume content on mobile in fundamentally different ways than they do on other channels. Creative Hub is an online interface, a “sandbox” where agencies can test different ad formats for online and mobile and experiment with what works best. In the past, most ad creation happens on desktop, but that is changing fast and Creative Hub’s experience is for a mobile device. The Creative Hub gives ad creators an easy way to preview their work in a dynamic mobile feed. They can also share mock-ups through a preview URL.

The Creative Hub is currently in test mode and should be available to everyone later in the year.

Facebook for small business continues to change almost daily.  We’ll (try) to keep you abreast of the latest updates and opportunities as we learn them.

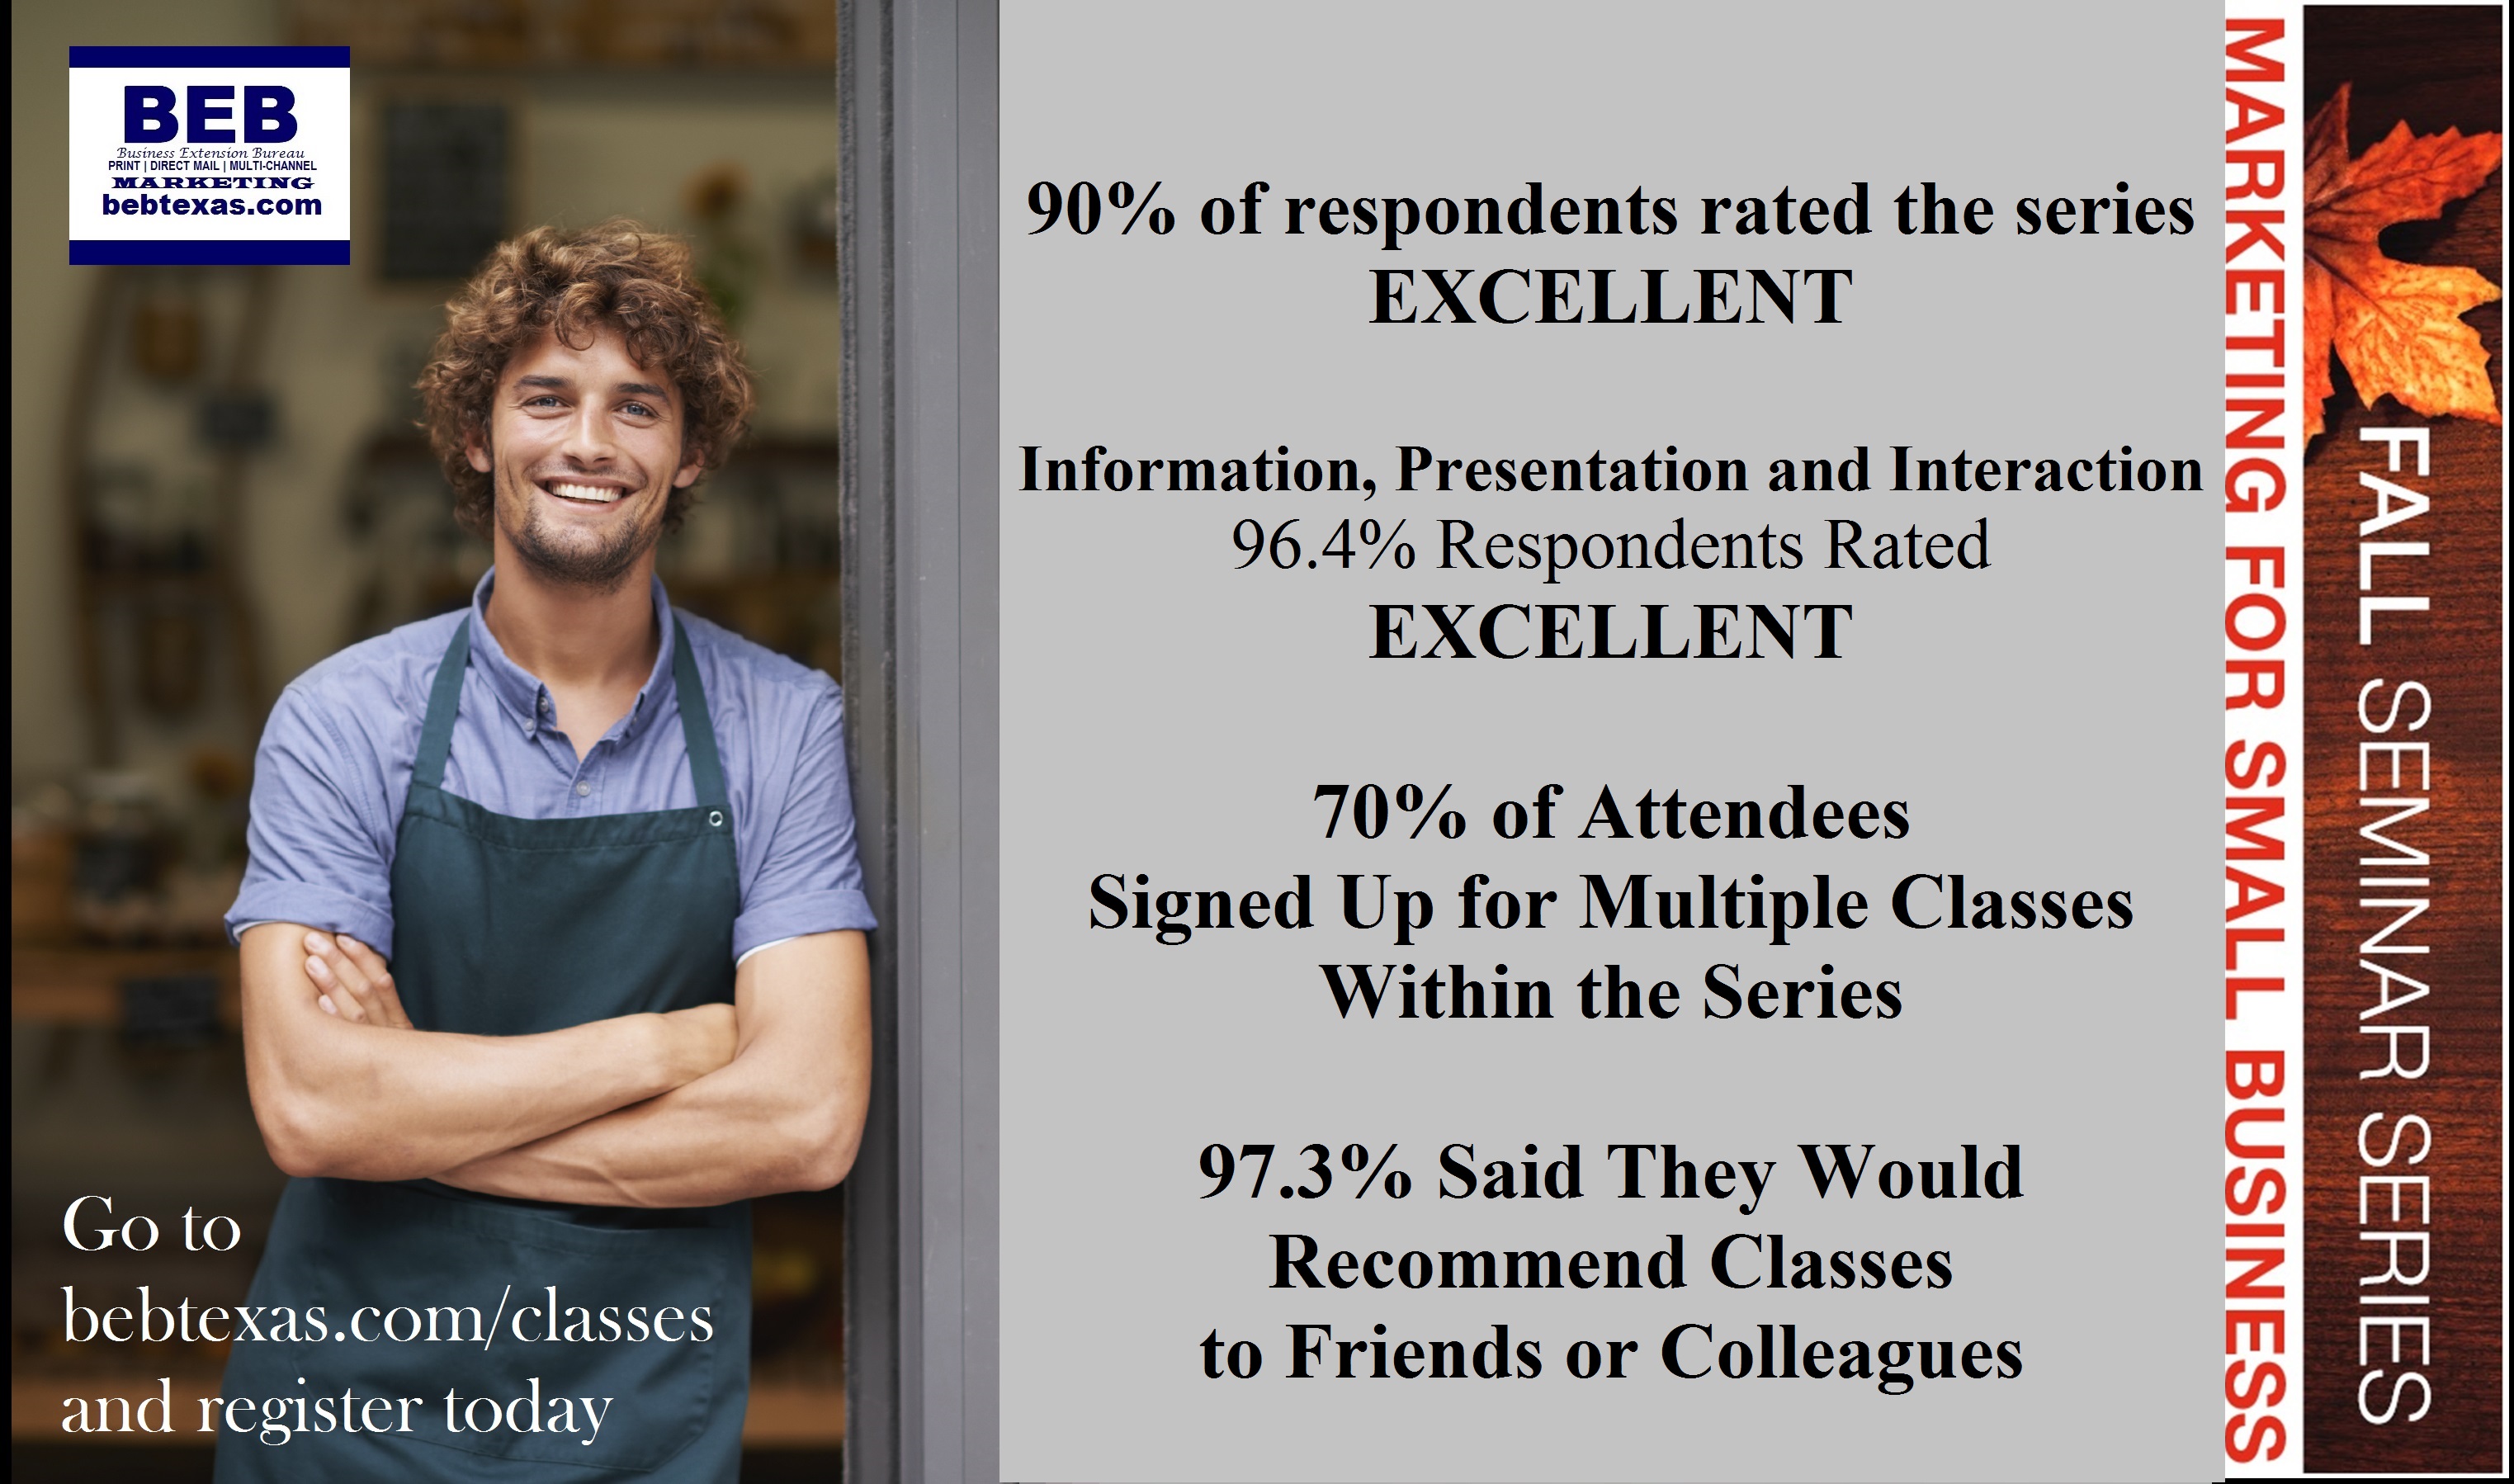
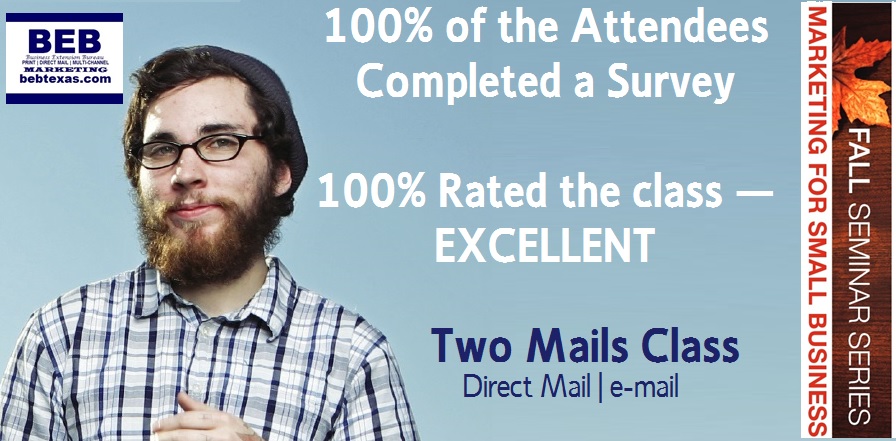
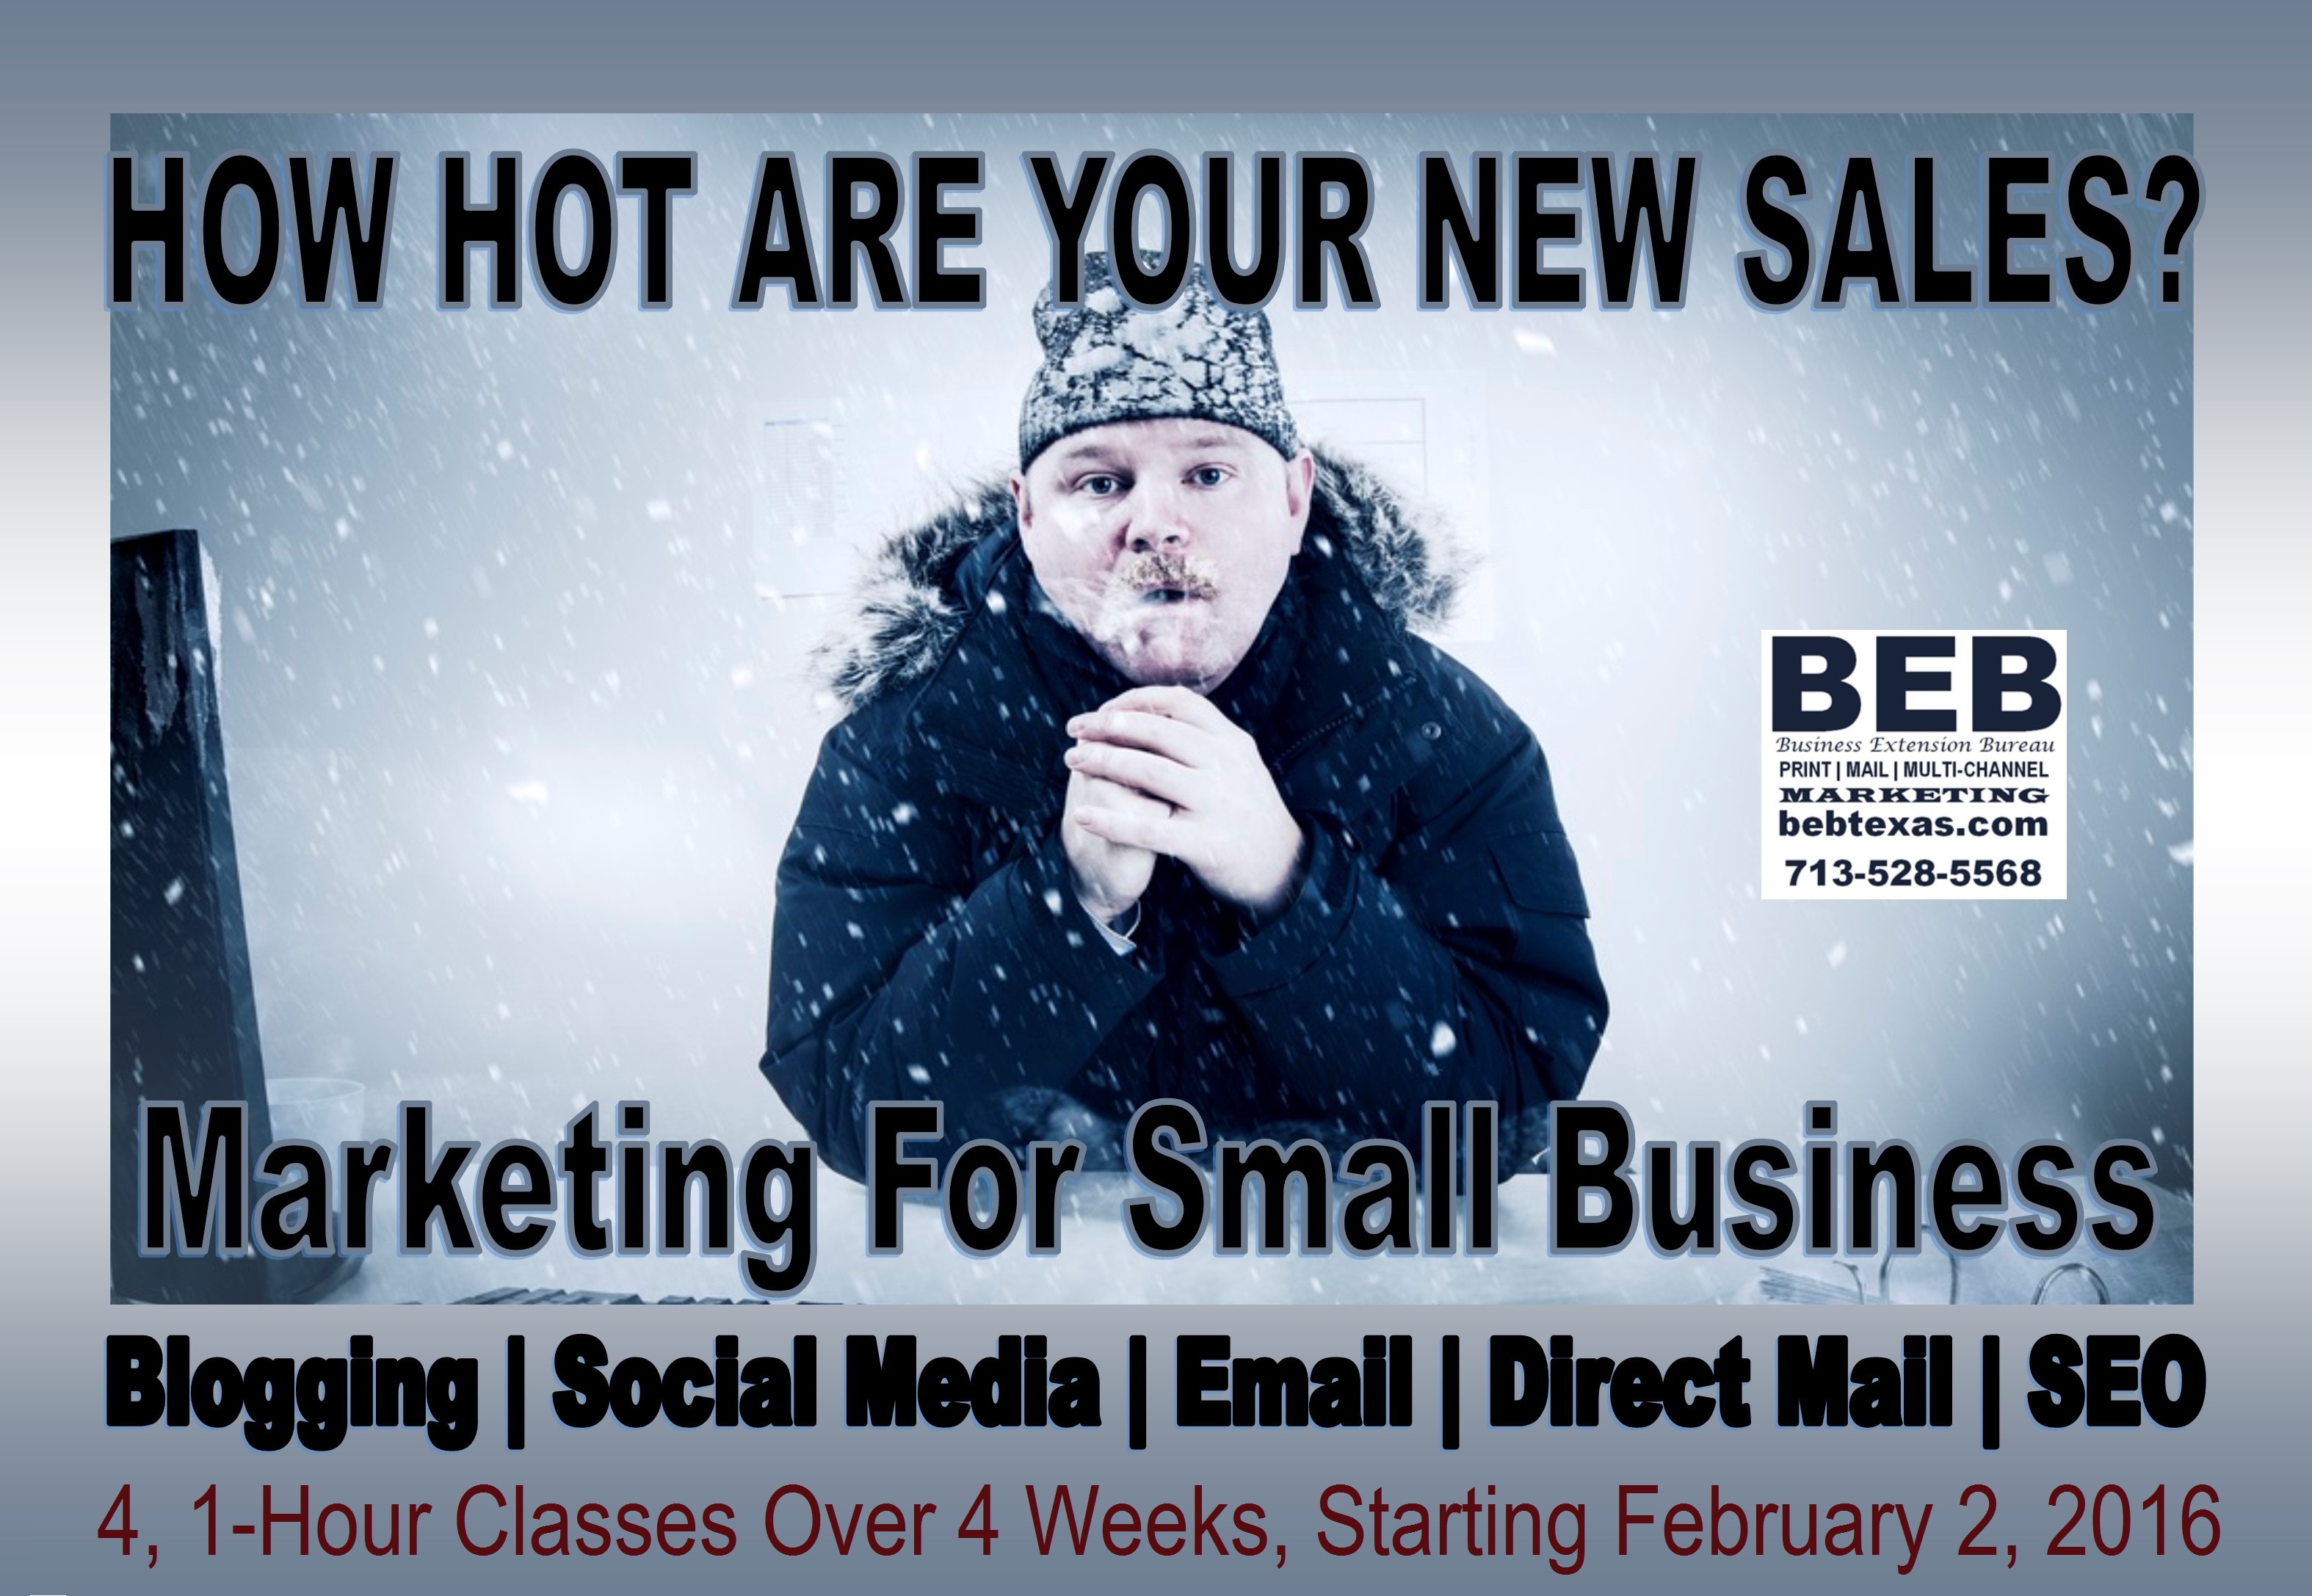
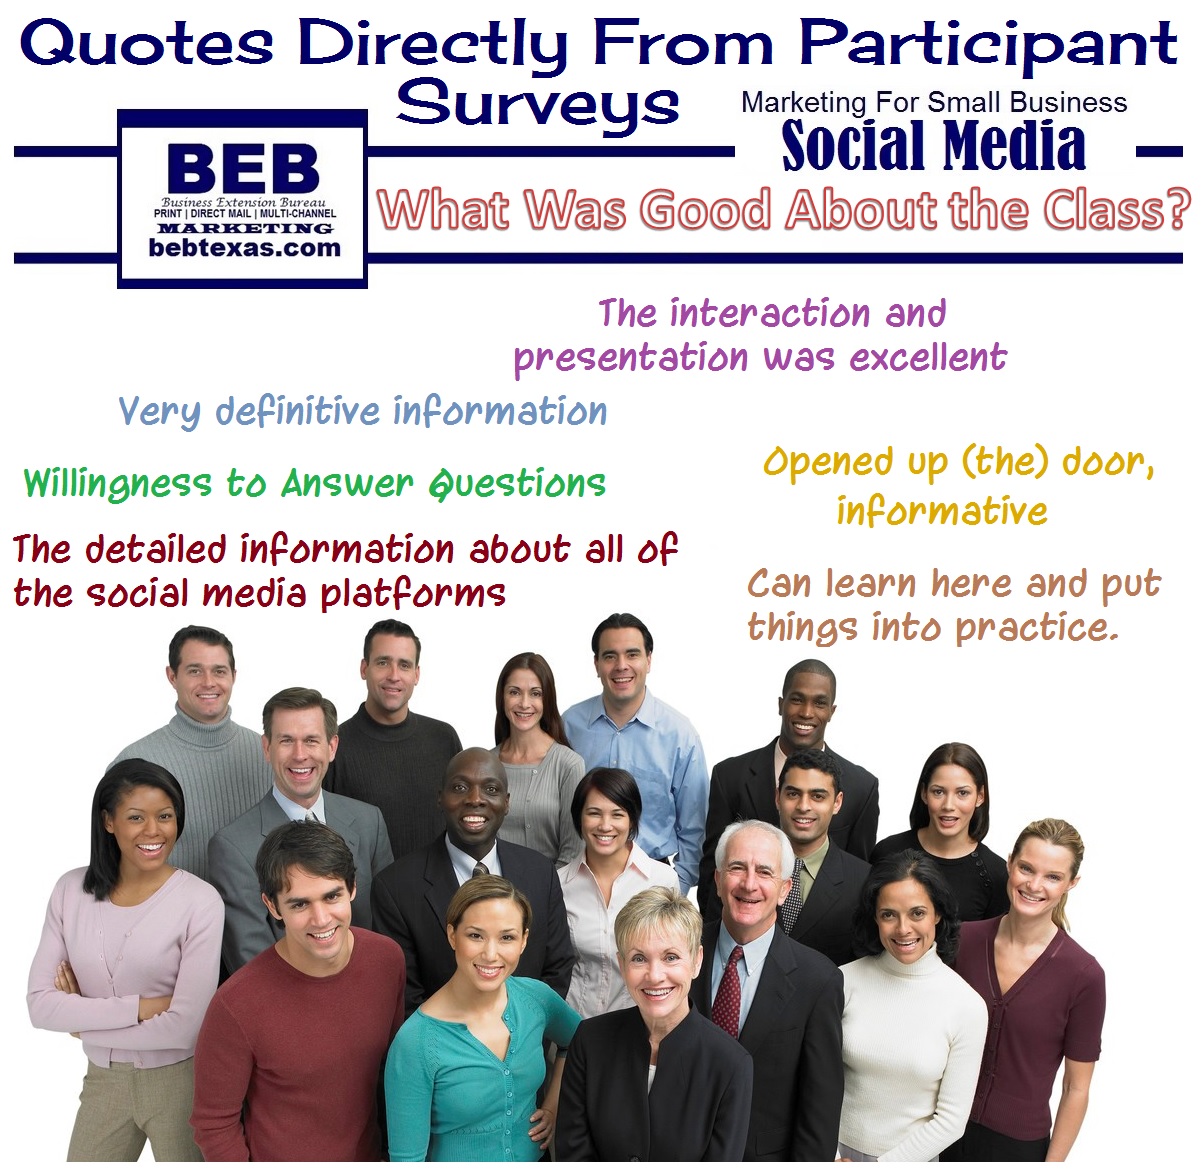
For more details, be sure to check out our Marketing for Small Business Classes too.  We offer two curriculum, The Basics and Intermediate.

The Basics course was specifically created for business owners and staff that are branching out their marketing to include digital.  The course includes four, 90-minute classes over four weeks.  Classes include Blogging, Social Media, Email Marketing, Direct Mail Marketing and Organic Search Engine Optimization.

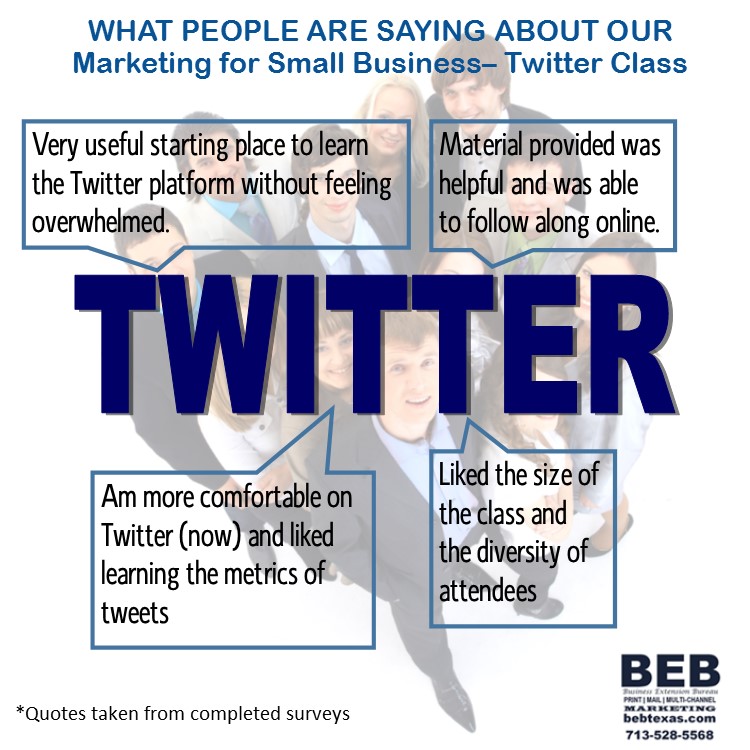
The Intermediate courses (also four, 90-minute classes over four weeks) are: HOW TO: Facebook, Twitter, LinkedIn and Constant Contact.  Check out details, dates and pricing here.
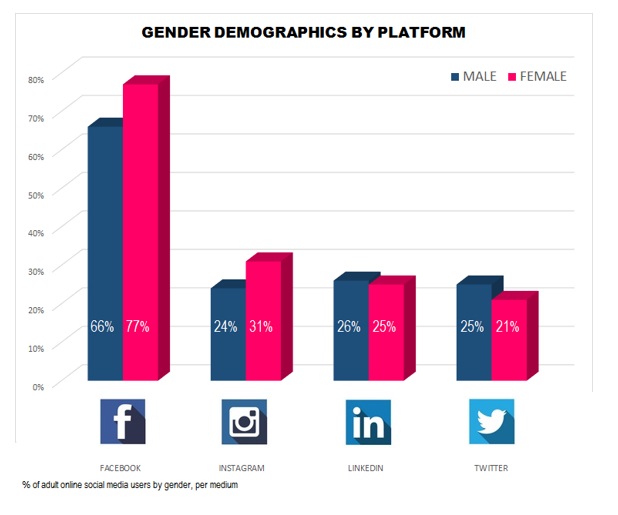
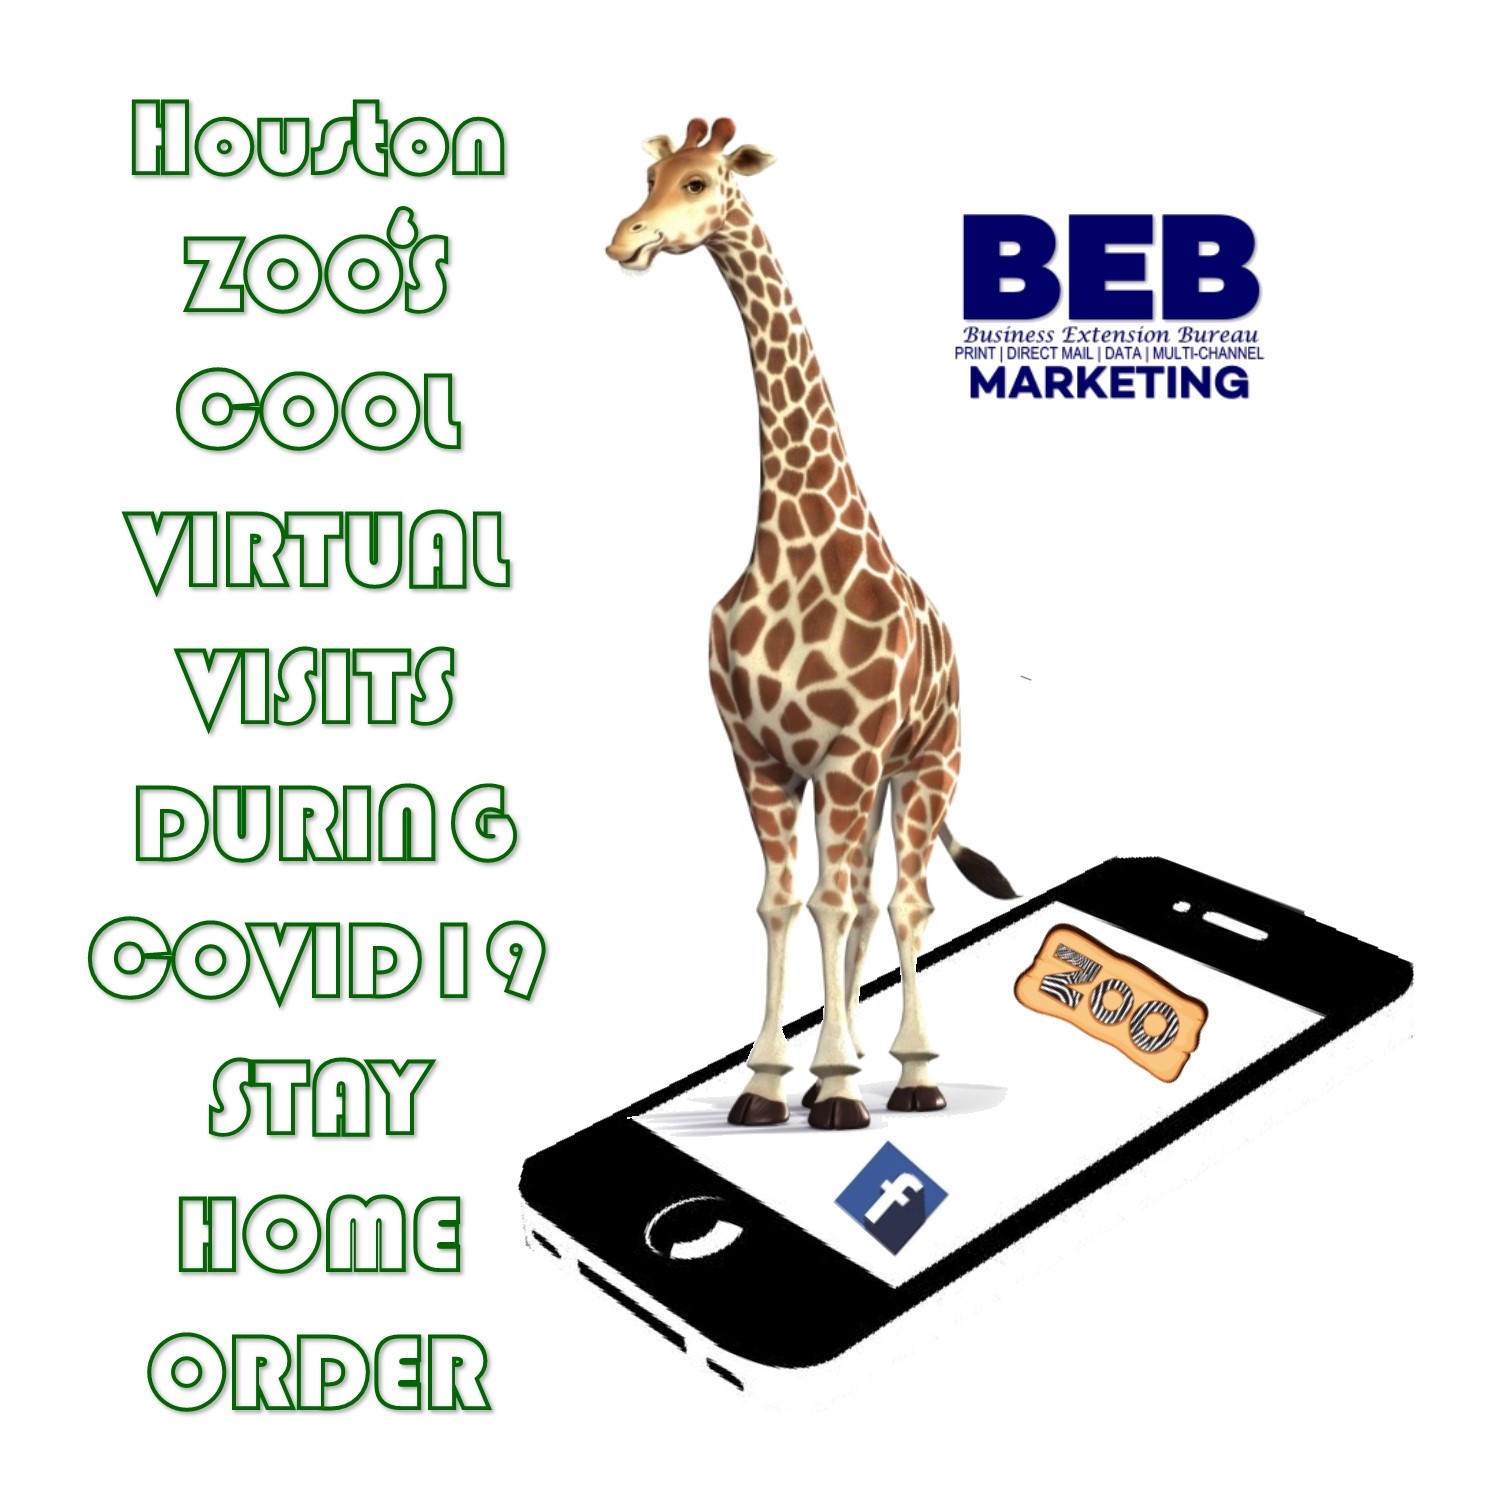
Winter Classes Scheduled

BEB Texas Marketing for Small Business 2016 Winter Seminar Series The BasicsWe are excited to announce that our ALL NEW Marketing for Small Business, Winter Seminar Series have been scheduled.  We are offering two different programs:

Marketing for Small Business, The Basics

Blogging:    Tuesday, February 2, 2016 11:30 – 1:00pm

Social Media: Tuesday, February 9, 2016 11:30 – 1:00pm

Email | Direct Mail: Tuesday, February 16, 2016 11:30 – 1:00pm

Search Engine Optimization: Tuesday, February 23, 2016 11:30 – 1:00pm 

Marketing for Small Business, 2.0

TWITTER 2.0: Tuesday, March 15, 2016 11:30 – 1:00pm

FACEBOOK 2.0: Tuesday, March 22, 2016 11:30 -1:00pm

LinkedIN 2.0: Tuesday, March 29, 2016 11:30 – 1:00pm

Classes have a maximum of 15 students for personalized learning and maximum interaction.  Cost is $30 per person, per class (with discounts for multiple class registration), and lunch is included.  The series is held at our facility in the heart of the Houston Museum District.

We’ve had over 60 attendees in the past year, and classes fill quickly.  Register today.

BEB Social Media Class Gets A Big Thumbs UP

Social Media Comments GraphicWe are (so) excited about the comments received from our (awesome) participants attending our Small Business, Summer Seminar Series.

Today’s session, the 2nd of 4, was an overview of social media. We researched profiles of the users of several platforms such as Twitter, Facebook, and LinkedIn. We reviewed unique applications such as hashtags, likes, and shares. And of course we covered ways to measure via Followers, impressions and reaches.

Our students were lively, engaged and represented so many different industries and services! Thanks to everyone for making today such a fantastic exchange!

We’ve created the graphic above to share some the comments received from surveys submitted from today’s class!  We look forward to seeing you (including the 90% that are continuing on) at next week’s class on “Two Mails”. Direct Mail and e-mail. Thank you again for your participation and contribution.  The balance of our Summer Seminar Series has SOLD OUT!

lets get social

DIRECT MAIL HIGHEST RETURN

2013-08-14 HEADER PHOTOWe were recently asked to assist a regional industry association with marketing their annual conference.  We created a multi-channel marketing campaign strategy that included direct mail, e-mail, tweets & Facebook posts, and video marketing.

Our audience consisted of the association’s current membership, lapsed members from a three-year period, and two targeted lists of prospective companies.  Prospects were identified through a partnership with a similar industry association and targeted businesses based on SIC codes within a five-segment, geographic area.

The campaign rendered attendance from over 30 companies, across the nation and Australia.  Twenty percent of the companies were first-time attendees and eight percent of the lapsed market was recaptured.

Direct mail brought the largest returns as 57.5% of the total registrations occurred within 10 days after a mailing and 57.1% of first-time registrations occurred within the same time frame.  We also saw that 33% of our total webpage traffic occurred within a ten-day period after a mailing.

E-mails that emulated the mail pieces and followed a mailing brought the second highest amount of activity.  Within 72-hours after a direct mail/e-mail,  23.1% of our total website hits occurred and 12.1% of attendees registered.

2013-08-14 CONF REGISTRATION CHARTGeneric e-mail blasts brought also brought 12.1% of the total registrations and comprised 15.8% of the total website activity within the 120-day campaign.

The social media component brought interesting results as well.  Nearly 25% of all website activity (24.7%) occurred on the day of positing on Facebook or Twitter, using a link connected to the website.  We noted that 14.6% of registrations occurred on days where social media was the only form of marketing used.

Seven videos were created and uploaded onto YouTube during the 120-day campaign bringing 399 views.  One-third of all views came from the inaugural, two-minute, introduction video that outlined location, topics and speakers.  Daily, 30-second spots, highlighting schedules for the three-day conference were watched by 18.7% of the registrants and accessed from a QR-Code conveniently placed on the cover of the conference program.

2013-08-14 WEBSITE ACTIVITY CHARTIn conclusion, the conference was a profitable and successful venture for the association.  Revenues were 13.4% higher than the previous year and first-time attendees were up 3.9% from 2011.